
The Northern Ireland Ambulance Service (NIAS) established the complex case team (NIAS-CCT) in 2017 to identify and respond to frequent callers (FCs). The NIAS-CCT aims to address the needs of FCs in the hope of reducing their effect on NIAS.
Ensuring service users are accessing the most appropriate care pathway to meet their individual health and social care needs has been proven to reduce demand on the emergency ambulance control, clinical support desk and operational ambulance resources (Edwards et al, 2015a). It has been reported that ignoring the challenge of inappropriate use of emergency services leads to inefficiencies, poor patient experience and clinically unsafe environments (Smith and McNally, 2014).
Snooks et al (2019) conducted a survey of how ambulance services across the UK were addressing the needs of FCs and reported various approaches. These strategies varied between regional services.
The Frequent Caller National Network (FreCaNN) covers all of the UK and defines a frequent caller as ‘anyone over the age of 18 who calls for an emergency ambulance more than five times in one month or more than 12 times in 3 consecutive months’ (FreCaNN, 2021).
Within NIAS, it has been observed that FCs can often present with social isolation, substance addictions, mental health conditions or unmet medical and social needs. There is a paucity of literature examining the characteristics of frequent users and their effects on emergency medical services (Scott et al, 2014a). It has been suggested they make up a heterogeneous group in regards to the nature of their unmet needs (Scott et al, 2014b). Edwards et al (2015b) said the ‘majority of frequent callers (86%) had multiple and complex reasons for calling… In the majority of cases (82%), multiple interventional strategies were required’ There is some evidence to suggest that patients who make high use of emergency healthcare may have a higher mortality rate than the general population (Moe et al, 2016). Therefore, further work to identify successful interventions to help this cohort of patients is warranted.
Addressing the needs of these service users can be time intensive. The standard process in NIAS involves a face-to-face, in-depth, holistic assessment with each service user. During the COVID-19 pandemic, this was adapted to telephone assessments. The process involves liaising with statutory and voluntary organisations and, with the patient's written consent, establishing a care pathway using a multidisciplinary approach.
Morgan and Thayre (2016) defined low-level 999 FCs as service users who call 999 5–9 times per month or ≥12 over 3 months and high-level 999 FCs as those who call 999 >10 times per month. They suggested that low-level callers ‘do not necessarily become higher-level FCs’, as the person's call volume may remain just over the threshold of the national frequent caller criteria and not increase.
It was therefore the aim of the authors to provide an intervention to service users who were regularly calling the ambulance service but not meeting the national criteria with the aim of directing them to the most appropriate care provider to meet their individual needs. Concurrently, the number of people meeting the national frequent caller criteria could be lowered, reducing overall demand on NIAS.
While the primary aim was to ensure appropriate care for service users, this project also aims to examine the potential impact of sending a mass distribution letter to potential frequent callers (PFCs) on emergency call volumes.
Methods
This service evaluation was conducted using a pre-post design, for which ethical approval was not required. The data set was anonymised before review by the research team. Approval to access, analyse and publish was granted by NIAS Health and Social Care Trust.
The primary aim was to assess the potential impact of a standardised PFC letter on 999 calls to NIAS. The NIAS-CCT defines a PFC as anyone aged ≥18 years who calls 999 nine or more times but <12 times in a 3-month period; calling ≥12 or more times over this period would move them into the FC category.
Participants were recruited by the NIAS-CCT, who identified service users who were calling 999 on a regular basis but had not yet met the national FC criteria. When a 999 call is received by NIAS, the emergency medical dispatcher (EMD) briefly summarises the issue in a section entitled ‘Reported Reasons’. The reported reasons from each service user's address were interrogated to ensure that the recipient was suitable to receive a letter. Exclusion criteria included callers receiving palliative care, those aged <18 years, people with visual impairment and those with a learning disability.
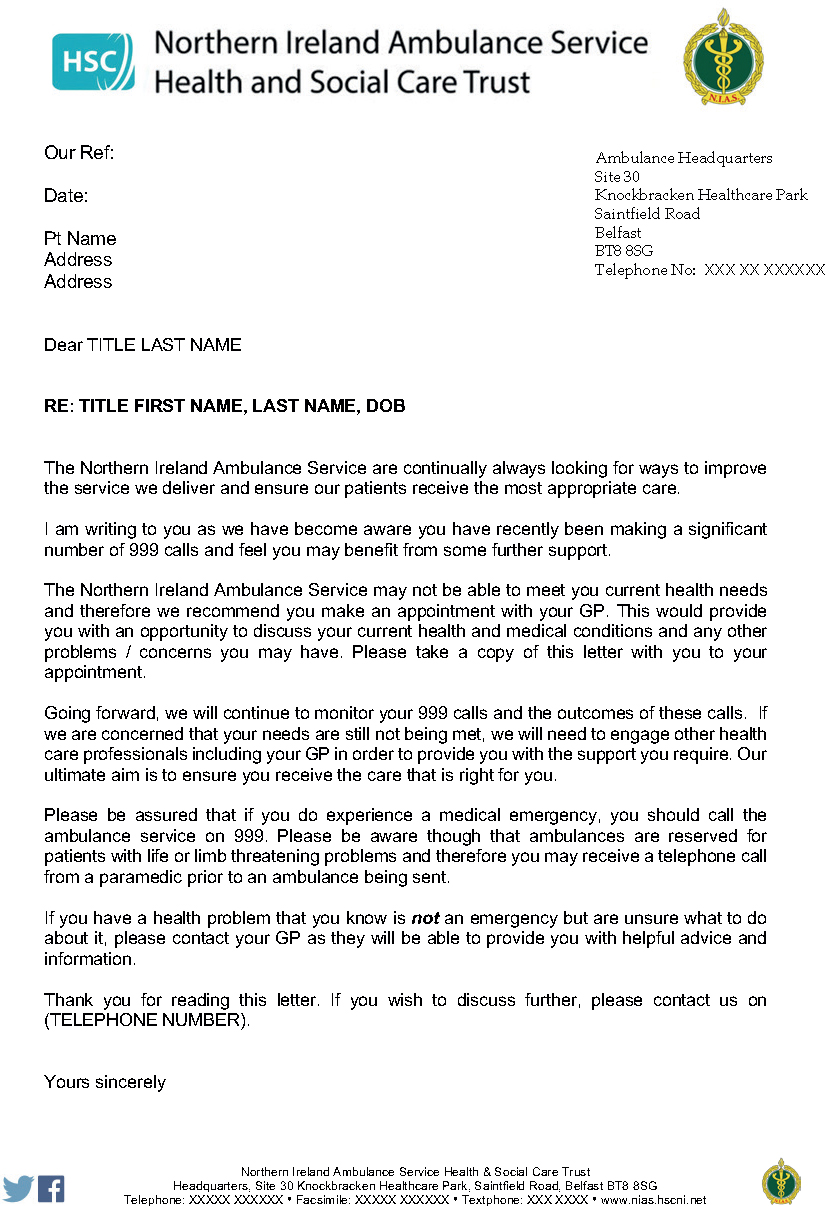
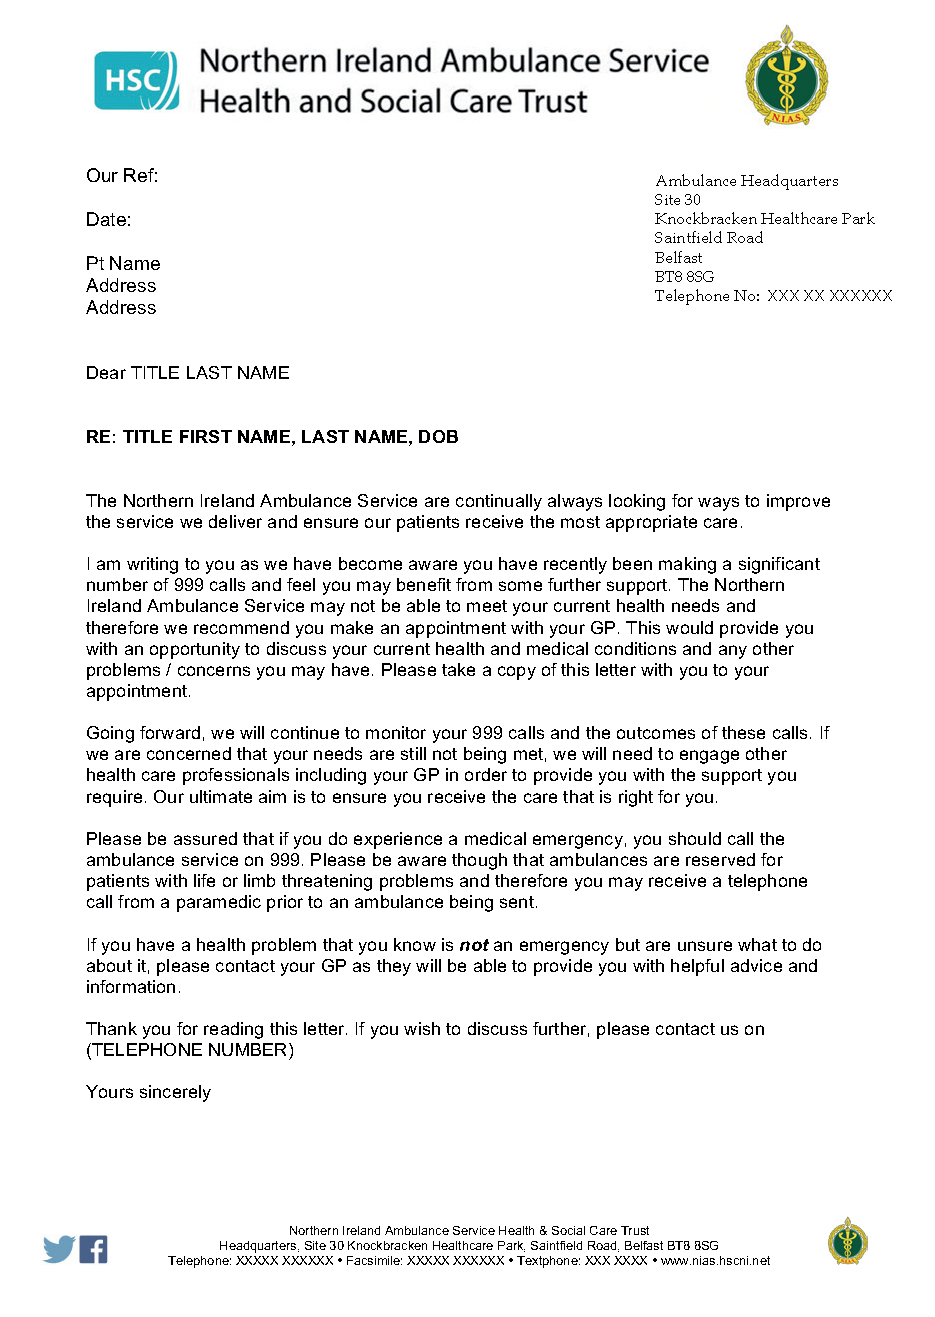
A letter was drafted by the NIAS-CCT and approved by the NIAS medical director. The letter informed the recipient that NIAS was aware of the emergency calls they had made and that the trust appreciated that they may be experiencing medical issues or anxiety but that NIAS may not be the most appropriate healthcare provider to meet their needs (Figure 1). The letter was reviewed between the first and second cohorts and amendments made (Figure 2).
Once a service user had been selected to receive a letter, their call volume over the previous 10 weeks was recorded. A letter was sent to the person's home address and any emergency calls over the following 10 weeks were recorded and a comparison made.
A number of letter recipients were randomly selected for a follow-up telephone call after the letter had been sent to establish whether they had contacted their GP or another care provider.
All 999 ambulance calls relating to PFCs, including those made by third parties, were logged during the 10-week time period following the start date of each cohort. At the end of each 10-week period, call volume data were collated and compared to the previous period.
Results
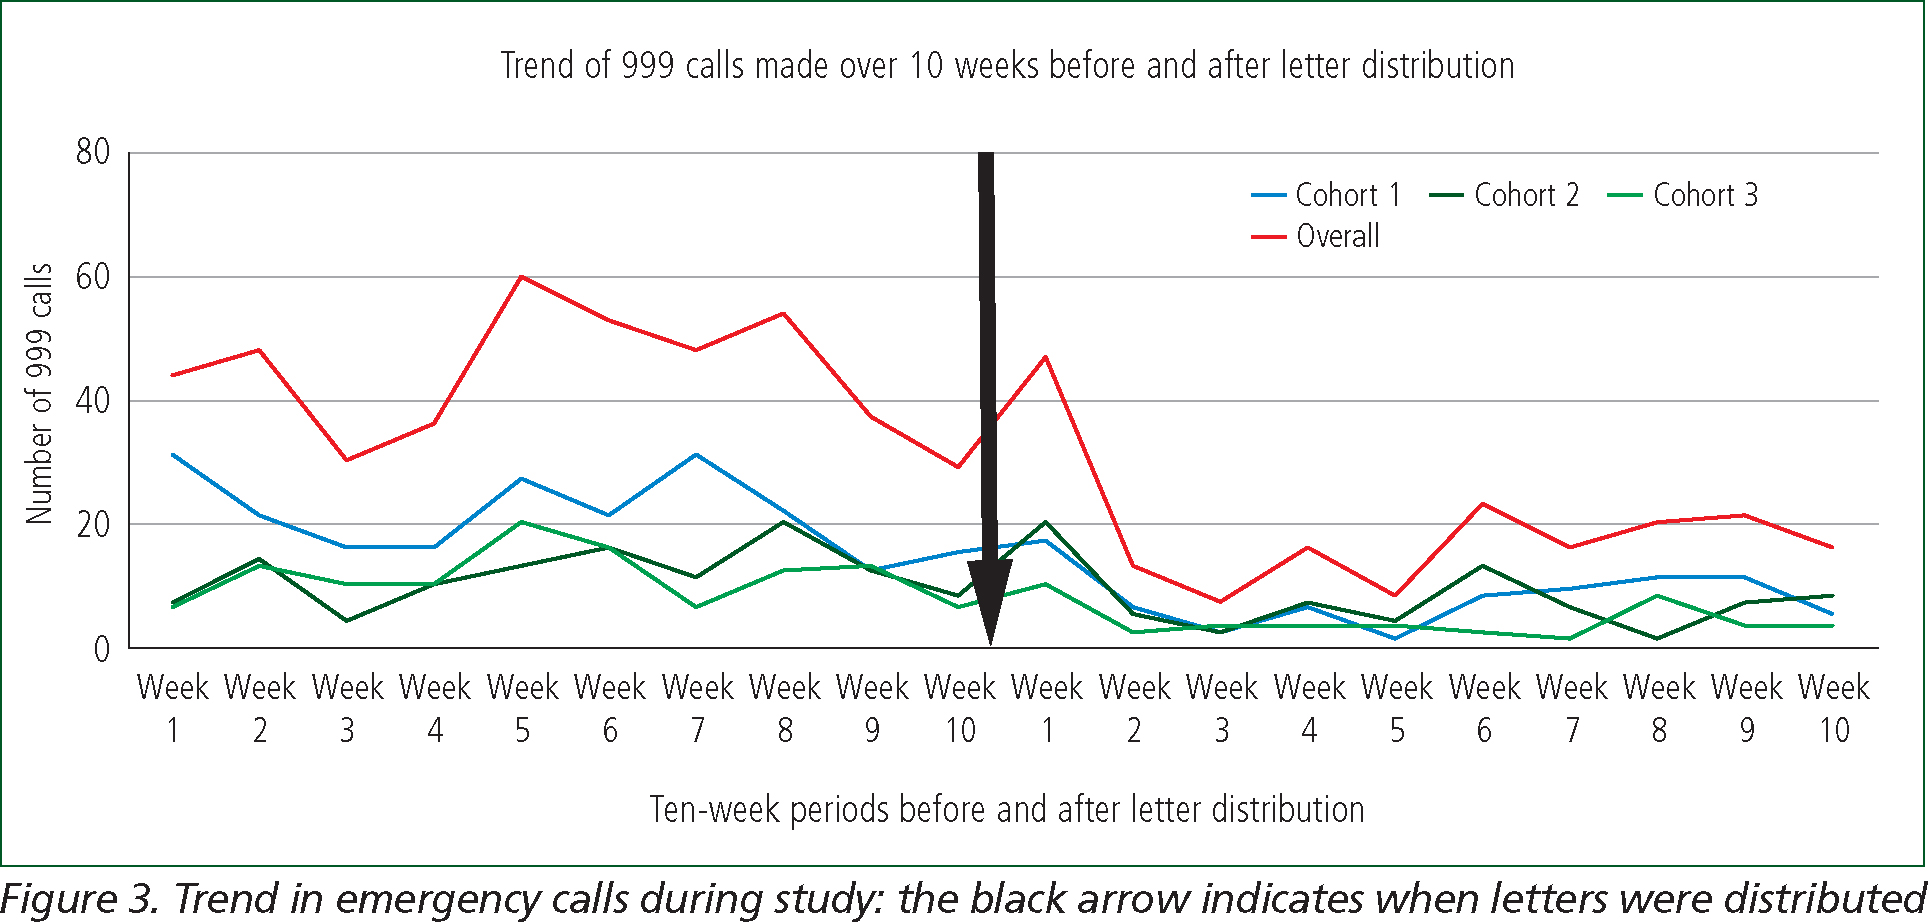
Cohort 1 saw a reduction from 212 calls to 76 in the 10 weeks after letter distribution, equating to a reduction of 64.2% in emergency calls. Cohort 2 had a reduction from 115 calls to 73 in the 10 weeks after being sent letters, equating to a reduction of 36.5% in emergency calls. Cohort 3 had a reduction from 112 calls to 38 in the 10 weeks after letter distribution, equating to a reduction of 66.1% in emergency calls (Table 1). Overall data from all three cohorts were combined and showed a reduction from 439 calls to 187 in the 10 weeks after letter distribution, equating to a reduction of 57.4% in emergency calls (Figure 3).
| Cohort | Number of recipients | Ten weeks before distribution | 10 weeks after distribution | Percentage reduction | ||
|---|---|---|---|---|---|---|
| Total no 999 calls | Average no weekly 999 calls | Total no 999 calls | Average no weekly 999 calls | |||
| Cohort 1 |
34 | 212 | 21.1 | 76 | 7.6 | 64.2% |
| Cohort 2 |
30 | 115 | 11.5 | 73 | 7.3 | 36.5% |
| Cohort 3 |
32 | 112 | 11.2 | 38 | 3.8 | 66.1% |
| Overall | 96 | 439 | 14.6 | 187 | 6.2 | 57.4% |
The NIAS-CCT attempted to contact 10 letter recipients on the telephone approximately 12 weeks after they had received the letter to ascertain if the advice to contact the appropriate care services was followed. Unfortunately, only three of the recipients answered the telephone.

Discussion
These results show that there was a clear reduction in 999 calls made by PFCs, with a mean decrease of 57.4% in the 10 weeks after letter distribution. Cohort 3 had the largest reduction of 66.1%.
This decrease in emergency calls would have lessened the pressures within the emergency ambulance control room. This drop in PFCs’ 999 call numbers suggests that there may be an association between letters being distributed and a reduction in emergency calls. Further work is needed to establish if a causal relationship exists.
The percentage reduction in emergency calls from Cohort 2 was notably less than recorded in Cohort 1 and Cohort 3. Further investigation is required to establish a reason for this.
One service user who answered the follow-up telephone call had sought assistance from their GP upon receiving the letter and support was being implemented for them. The timeline of this intervention was concurrent with a reduction in emergency calls from this service user. The number of recipients contacted was limited by the amount of time NIAS-CCT staff had available. With so few letter recipients answering the follow-up telephone call, there is a lack of data from which to conclusively evaluate the effectiveness of the letter in encouraging self-seeking assistance. Further research is required to ascertain what actions, if any, recipients took after receiving the letter. This information is pertinent as recipients may have increased contact with other services or, conversely, act contrary to the advice on the letter and stopped seeking care completely. Data on the subsequent impact of this reduction in calls to NIAS on other services and teams within the health and social care service were not collected during this study.
In 2019, the NIAS-CCT delivered presentations to the Northern Ireland GP Federation, highlighting the work of the NIAS-CCT and answering delegates’ questions regarding the engagement with FCs.
Further engagement with GPs and other health professionals in the development of similar future projects would assist in providing an inter-agency wraparound approach.
The author believes that one reason for such a low answer rate to the telephone calls could be them being made from a withheld number. The facility for a service user to call back was not available. While the number of recipients the author attempted to contact via telephone was small, the low response rate may nonetheless indicate that sending letters may be a more effective method of communication with this cohort than telephone calls. Further research into this using bigger sample sizes would be required to give a more robust association.
The scarcity of literature on this topic makes it difficult to assess if the findings support or contradict the findings of other services.
However, research has been conducted using written correspondence to FCs drawn up with a suicide prevention centre to supplement telephone support. The small study involving five FCs found that by commencing a 6-month correspondence with the caller, the ‘frequency and length (minutes) of calls per month to the crisis line dropped for most of the callers’ (Brunet et al, 1994). Additionally, it may be worth examining if certain cohorts of service users prefer or receive more benefit from different forms of communication.
The NIAS-CCT received a small number of concerns from recipients. One had the impression they were no longer allowed to contact NIAS and another was concerned this would affect a sick relative at the same address. These issues were individually addressed. Often a telephone discussion between the NIAS-CCT and the service user was enough to ease any apprehensions. Furthermore, the recipients were offered the opportunity to discuss any health and social care concerns they had and advice given as to who they should contact for specific support.
Emergency calls to NIAS do not always result in a dispatch of an ambulance or response vehicle so the financial impact in this study is difficult to establish. However, Curtis and Burns (2020) have estimated the breakdown of costs to UK ambulance trusts for each incident they are involved in by way of national averages. A ‘call only’ had a national average cost of £7, a ‘hear and treat and refer’ cost a national average of £48, ‘see and treat and refer’ cost an average of £214, while ‘see and treat and convey’ cost an average of £263. An overall average was recorded as £133. While these figures are averages and do not relate to the NIAS, it gives some indication of the cost that may have been incurred. Based on ‘call only’ savings alone, letter distribution may have saved £1764 over a spread of 96 service users.
Further work in this area includes the use of technology to develop QR codes and multimedia patient information resources to educate and inform service users with regards to the role of 999 ambulance services. Any such future study should include a variety of written and digital media, with consideration given to the option of language translation to reduce the possibility of digital exclusion or potential health inequalities resulting from language barriers or any other potential contributors. This is especially important in the cases of FCs who may be unable to avail themselves of digital support because of higher rates of poverty (Hunt et al, 2006; Agarwal et al, 2019).
Conclusion
This paper demonstrates that, by identifying PFCs and intervening with a standardised letter, it is possible to reduce emergency calls they make.
The process of distributing a standardised letter to identified PFCs was straightforward. The NIAS-CCT defined a PFC as anyone aged ≥18 years who calls 999 nine or more times in a 3-month period (but less than 12 times as this would move them into the FC category).
While the primary aim of the letters was to direct service users to appropriate care, a lack of follow-up telephone discussions with recipients has made an accurate evaluation of this impossible.
As this paper is a retrospective review, no data from a control group was collated. The inclusion of such would offer an improvement opportunity for any similar studies in future.