
Demand for ambulance services is prone to within-day, within-week and within-year fluctuations (Cantwell et al, 2013) that are well understood. However, increasing year-on-year demand has also been widely reported in the literature (Cadigan and Bugarin, 1989; Wrigley et al, 2002; Lowthian et al, 2011) demonstrating a national pattern, but has received only limited research attention (Clark and FitzGerald, 1999; Lowthian et al, 2011). In South West England, the ambulance service has seen a rolling growth in the activity of its A&E service line of between 4–5%. This increased growth has occurred over the last 6 years, and includes all incidents originating both from members of the public and healthcare professionals calling 999.
The reasons behind this escalating overall demand are less clear, and while it has been postulated that broad factors such as an ageing society (Clark and FitzGerald, 1999) and increasing alcohol-related incidents (Brokaw et al, 1998) might be responsible, it is difficult to determine the predominant drivers of ambulance demand without quantifying and comparing the impact of these factors on ambulance demand.
Previous studies that have looked at factors that potentially influence demand for ambulance services have typically focused on the influence of single factors (Bray et al, 2011; Holzer et al, 2012; Wong and Lai, 2012) or small subsets (Aldrich et al, 1971; Clark and FitzGerald, 1999). Modelling studies that have looked more widely across a range of factors typically only consider ambulance demand as a component of the demand for accident and emergency services (Brailsford et al, 2004), but this does not capture considerations that are exclusive to the ambulance service, such as attendances that do not result in a subsequent conveyance to a hospital.
System dynamics (or whole systems modelling) is a computer simulation method that offers a means of modelling high-level or abstracted systems, and the flows between elements in these systems (e.g. the movement of patients or the flow of information between organisations (Lattimer et al, 2004)). Such models can be useful in broadly determining the elements that most affect the rates of flow around a system. In the context of ambulance demand, a system dynamics model can represent the flow of people who call an ambulance, and the interlinking factors that determine the rate of this flow. In this paper, we present such a model, and demonstrate how we used this model to determine the most significant factors contributing to the level of demand for ambulance services.
Methods
Determining the influencing factors and their relationships to ambulance demand
In order to determine the factors that might influence ambulance demand, we searched the literature and sought expert opinion via multiple meetings with representatives from the South West Ambulance Service NHS Foundation Trust (SWAST). We conducted a search across the Medline, Embase, CINAHL, BNI, HMIC and SPP databases using the keyword ‘ambulance’ along with ‘use’, ‘usage’, ‘demand’ or ‘utilisation’, and ‘influence’, ‘factor’, ‘driver’ or ‘correlation’. This search resulted in 210 unique hits. The abstract from each publication was studied manually to identify those studies that discussed potential factors that influence demand for ambulance services. In total, 18 publications met this criterion, and all other publications were rejected.
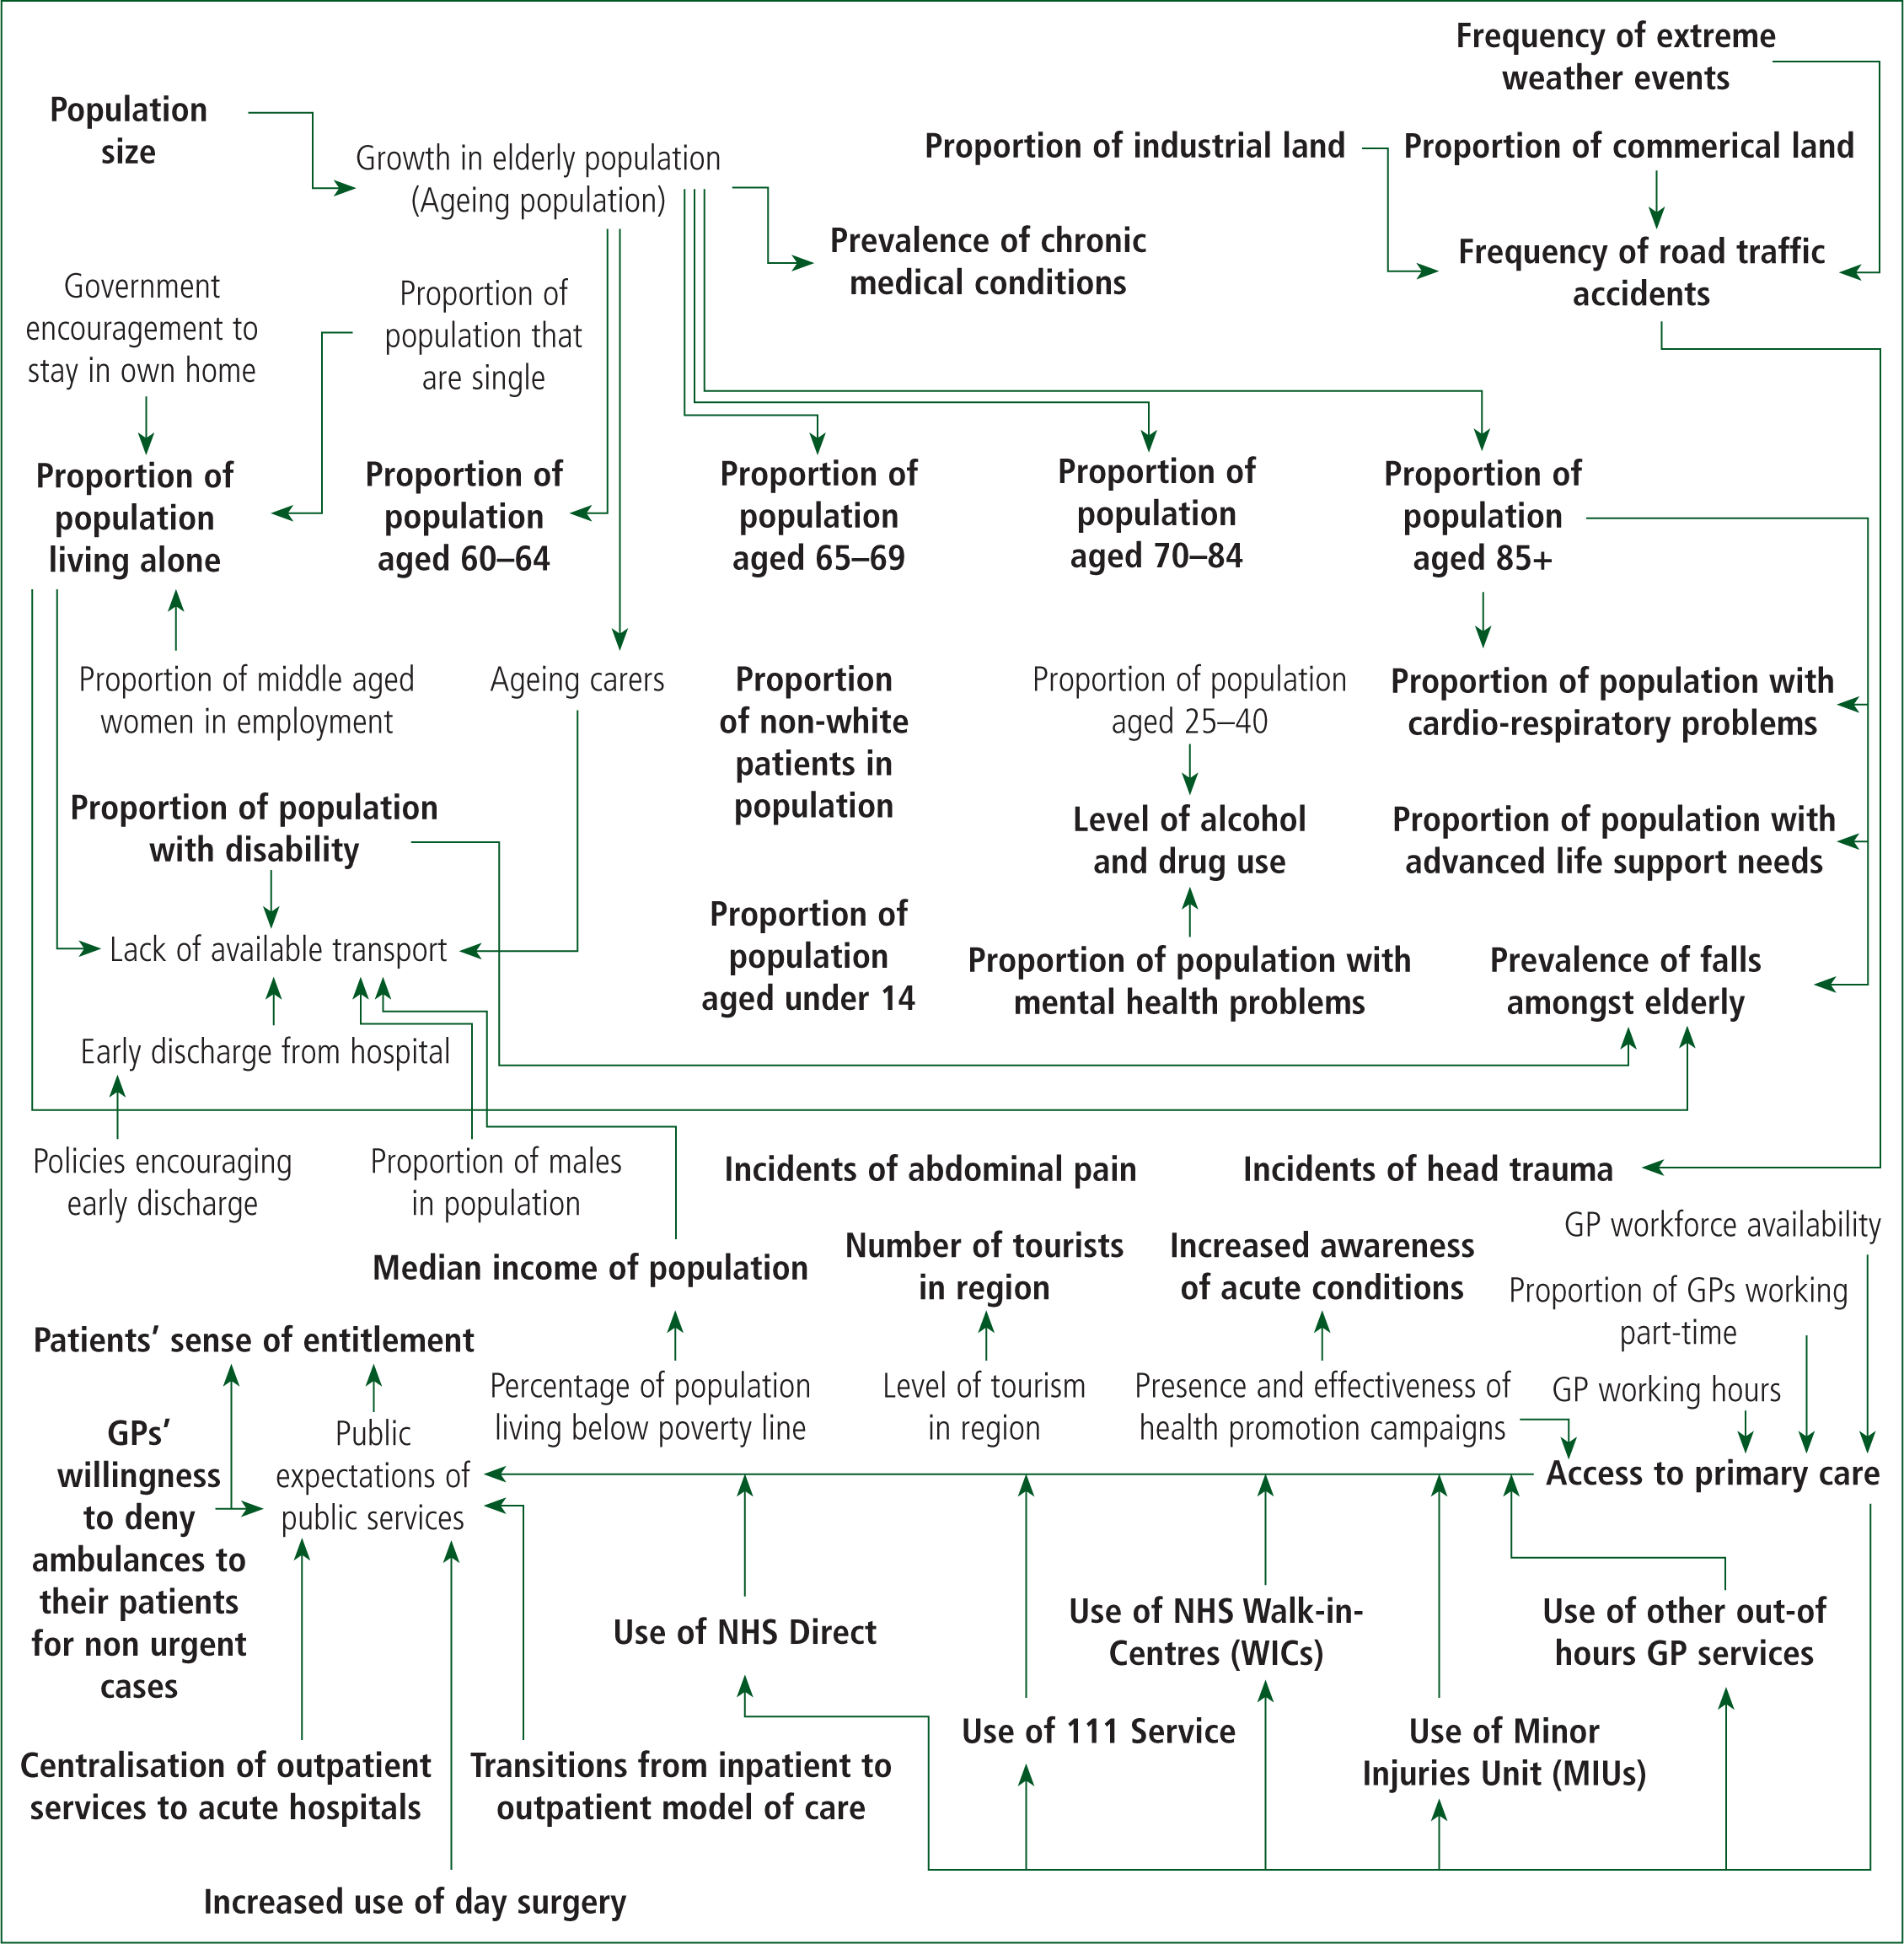
We constructed a map of the influences described in the literature by identifying any potential factors along with their links to both ambulance demand and each other (Figure 1). We included any relationships that were mentioned in the literature, even if there was no quantitative description of the relationship, or if the relationship was only postulated.
The influence map was shared with stakeholders from the ambulance service and modified based on their expert opinion. Such methods have been used before (Brailsford et al, 2004) and are a useful means of promoting discussion about a complex system using a common starting point.
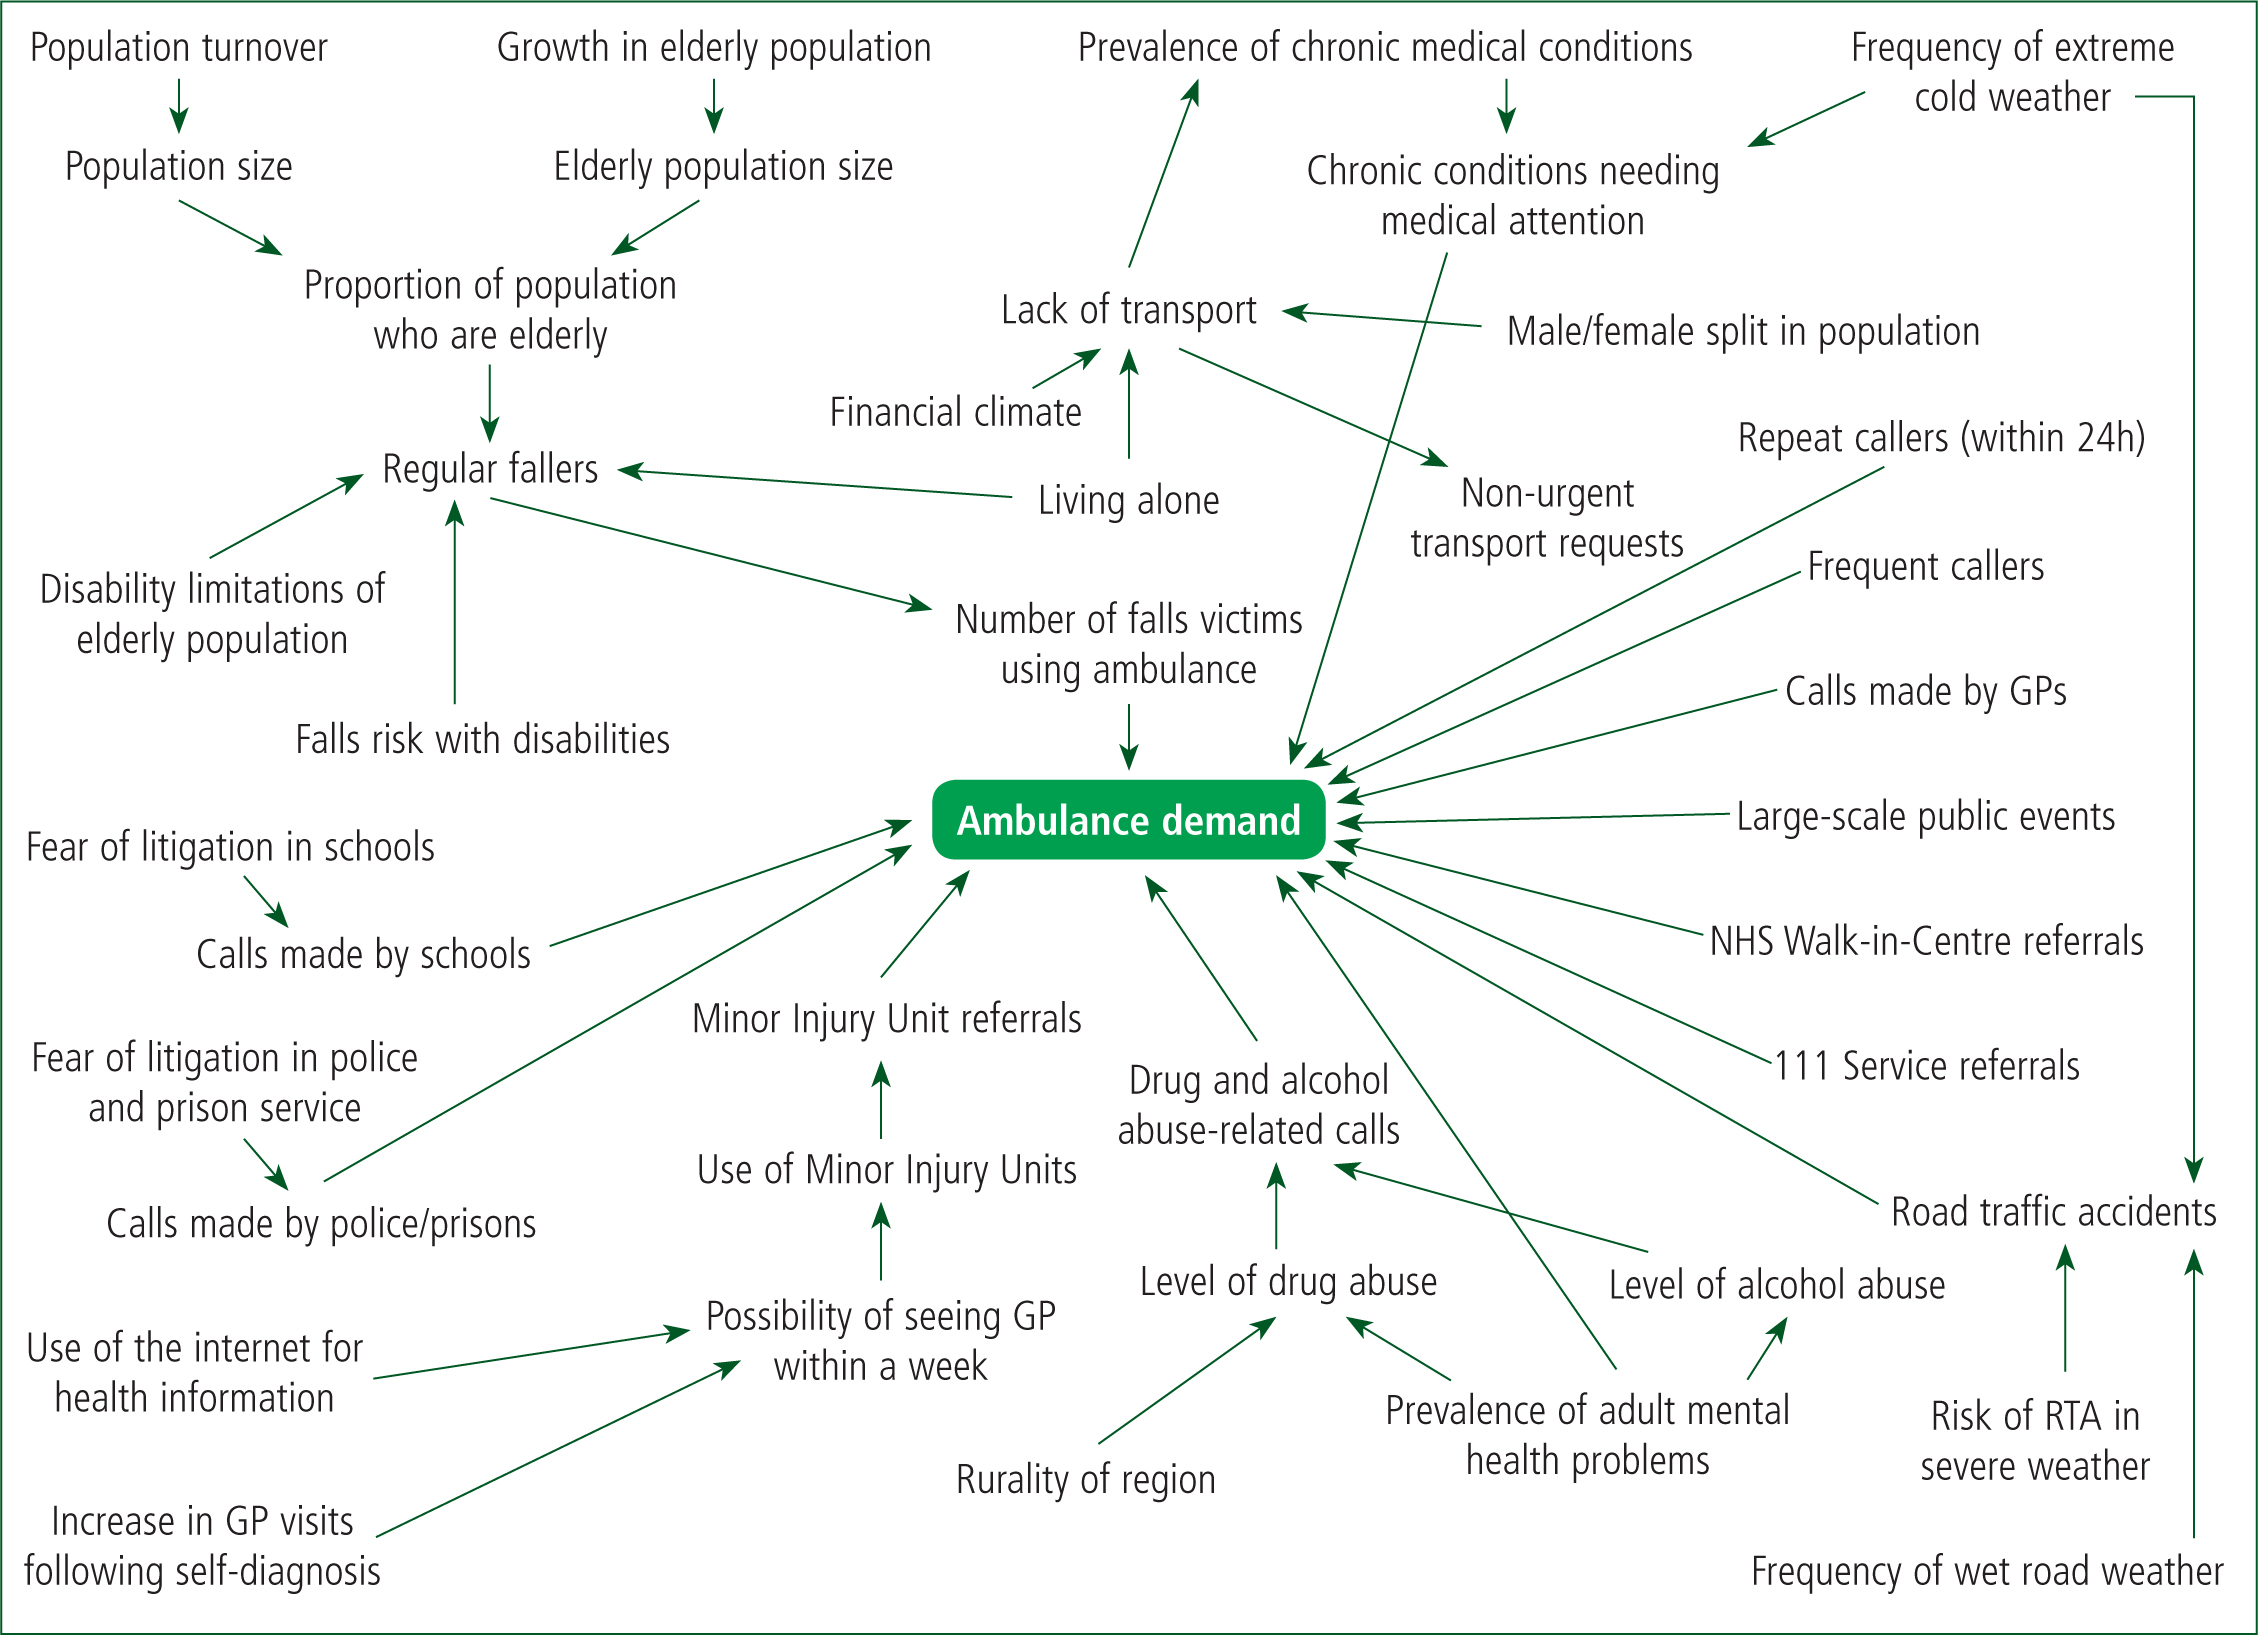
Finally, we removed any relationships from the influence map that could not be represented in the model because of a lack of data about those relationships (such as the impact of a GP's unwillingness to deny their patient non-urgent ambulance transportation (Clark and FitzGerald, 1999)), or because the literature indicated that such relationships do not significantly influence demand for the ambulance service. For example, the presence of health promotion campaigns such as the FAST campaign for stroke—a UK campaign to increase awareness of key signs of the onset of stroke—may increase awareness but have limited impact on changing behaviours (Lecouturier et al, 2010). Figure 2 shows the final influence map used by the model.
Model structure
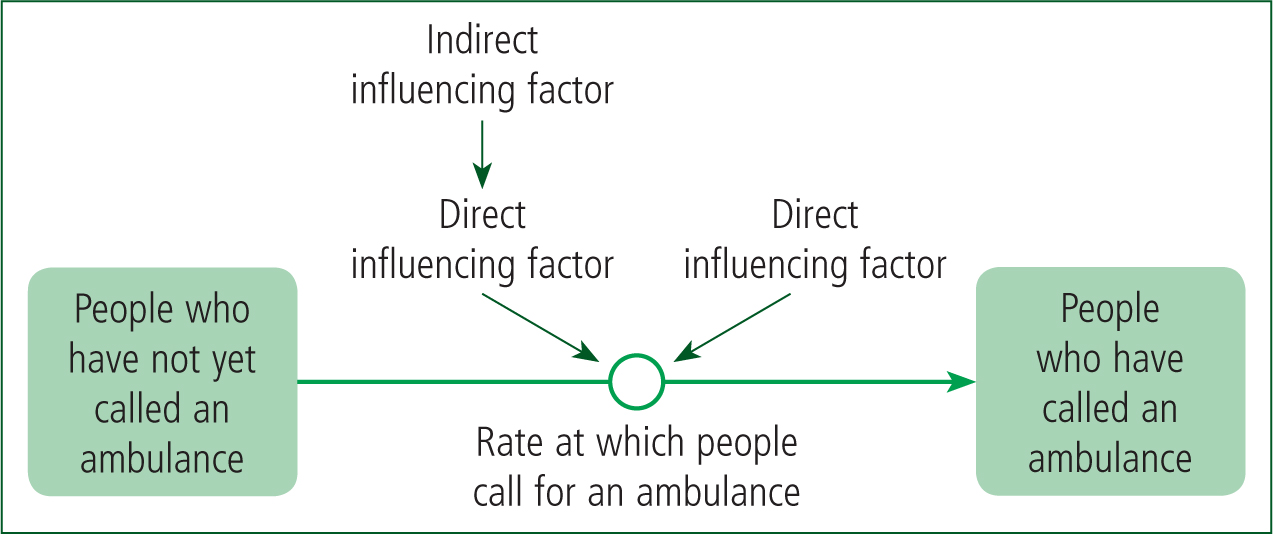
The fundamental structure of the model is represented in Figure 3. Patients transition from a population that has not called for an ambulance, to a population that has, at a rate determined by influencing factors that both directly and indirectly influence ambulance demand. Time advances in 1-month intervals over the course of 12 months. Table 1 describes the specific data used to parameterise the modelled relationships.
| Description of data | Date value used | Source(s) of data |
|---|---|---|
| Population | ||
| Size of population in SW England | 5 288 935 | Office for National Statistics, 2011 |
| Net annual migration into SW England | 19 400 | Office for National Statistics, 2013a |
| Size of population in SW England in 2013 | 5 327 735 | Size of population in 2011 + 2 years of net migration |
| Percentage of SW population aged 60 or over | 26.42% | Office for National Statistics, 2011 |
| Annual increase in over 60 or over population | 2.05% | Office for National Statistics, 2013c |
| Percentage of males in the population | 49.5% | Office for National Statistics, 2011 |
| Access to transportation | ||
| Percentage of adult males that do not own a car | 18% | Department for Transport, 2016 |
| Percentage of adult females that do not own a car | 22% | Department for Transport, 2016 |
| Percentage of those aged 65 or over who do not own a car | 34% | Office for National Statistics, 2011 |
| Percentage of population that live alone | 29% | Office for National Statistics, 2011 |
| Percentage of those aged 65 or over who live alone | 44.56% | Office for National Statistics, 2013c |
| Percentage of single occupancy households that have no car | 61% | Office for National Statistics, 2011 |
| Percentage of people at lowest income level who do not own a car | 2.65% | Department for Transport, 2015b |
| Percentage of people at highest income level who do not own a car | 0.64% | Department for Transport, 2015b |
| Current income level relative to pre-recession income level | 95.5% | Median income has fallen by 3.8% since economic downturn (Office for National Statistics, 2013b). Therefore, we assume current income = 96% of pre-recession levels |
| Number of calls per month for non-urgent transport | 773.2 | SWAST |
| Percentage of people without transport or means to pay for transport who use the ambulance for non-urgent requests each month | 0.01% | 773.2 calls represents 0.01% of the population of SW England (Office for National Statistics, 2011). We assume that 100% of non-urgent transport requests are from people without their own transport |
| Disabilities and falls | ||
| Percentage of older people ‘limited a little’ by disability | 28.7% | Office for National Statistics, 2011 |
| Percentage of older people ‘limited a lot’ by disability | 29.5% | Office for National Statistics, 2011 |
| Percentage of those ‘limited a little’ by disability who regularly fall | 31% | Tinetti et al, 1986—assuming 4–6 disabilities = ‘limited a little’ |
| Percentage of those ‘limited a lot’ by disabilities who regularly fall | 100% | Tinetti et al, 1986—assuming 7–9 disabilities = ‘limited a lot’ |
| Percentage of people aged 65 or over who have multiple falls within 12 months | 17% | Kharicha et al, 2007 |
| Number of calls per month coded as falls | 7 094 | SWAST |
| Estimated number of older people in SW England who regularly fall over the course of a year | 536 535 | Those ‘limited a little’ by disability who regularly fall = 28.7% of those ‘limited a little’ = 124 321. Those ‘limited a lot’ by disability who regularly fall = 100% of those ‘limited a lot’ = 412 214. Total = 536 535 |
| Estimated percentage of falls that result in an ambulance call | 16% | Regular fallers averaged over 12 months = 44,711 per month. 7 094/44 711 = 16% of falls result in ambulance call each month |
| GP and minor injury unit referrals | ||
| Average number of attendances per year to a minor injury unit in Devon | 7 250 | Busiest MIUs in Devon receive around 11 500 attendances per year, compared to 3 000 attendances at the quietest (NHS Devon, 2011). Average taken between these extremes. |
| Number of calls per month from Minor Injury Units | 283.8 | SWAST |
| Number of calls per month from NHS walk-in centres | 11 | SWAST |
| Percentage of patients attending MIUs because wait to see GP is too long | 13.1% | Dolan and Dale, 1997 |
| Percentage of patients who have to wait a week or more to see their GP | 15% | Royal College of General Practitioners, 2013 |
| Percentage of population that use the internet to obtain health information | 58% | Iverson et al, 2008 |
| Percentage of population using internet to obtain health information who increase GP visits as a result of self-diagnosis | 37% | Iverson et al, 2008 |
| Number of calls per month from GPs | 789 | SWAST |
| Chronic medical conditions | ||
| SW England 65 and over prevalence rate of chronic medical conditions (atrial fibrillation, asthma, cancer, coronary heart disease (CHD), chronic kidney disease (CKD), chronic obstructive pulmonary disease (COPD), dementia, diabetes, hypertension and stroke) | 14.2% | Public Health England, 2009 |
| SW England under 65 prevalence rate of chronic medical conditions | 2.5% | Public Health England, 2009 |
| Estimated percentage of those with chronic medical conditions who call ambulance each month | 0.288% | On average, each month SWAST receives 166 calls relating to atrial fibrillation, 308 calls relating to asthma, 378 calls relating to COPD, 441 calls relating to diabetes and 633 calls relating to stroke. This represents an average of 0.288% of those with chronic medical conditions. |
| Additional calls per month from those with chronic medical conditions during coldest months (January and February) | 76 | SWAST |
| Road traffic collisions and extreme weather events | ||
| Average number of road traffic collisions per month in SW England | 982 | Devon County Council, 2013 |
| Likelihood of RTC on wet road compared to dry road | 1.74 times more likely | Andrey, 2010 |
| Likelihood of RTC in snowy conditions compared to dry conditions | 1.89 times more likely | Andrey, 2010 |
| Percentage of RTCs in SW England that are on wet roads | 32.8% | Department for Transport, 2015a |
| Percentage of RTCs in SW England that are in snowy or icy conditions | 1.78% | Department for Transport, 2015a |
| Illicit drug and alcohol abuse | ||
| Percentage of population who use illicit drugs | 8.2% | Home Office, 2013 |
| Percentage of population who consume alcohol to an excess that is potentially harmful | 24% | NHS Choices, 2015 |
| Percentage of 16–59-year-olds in urban areas who use illicit drugs | 8.6% | Home Office, 2013 |
| Percentage of 16–59-year-olds in rural areas who use illicit drugs | 6.4% | Home Office, 2013 |
| Population of SW England who live in rural area | 33% | Pateman, 2011 |
| Percentage of those with mental health problems who abuse substances | 40% | Mental Health Foundation, 2007 |
| Percentage of population who use adult mental health services | 2.5% | Health and Social Care Information Centre, 2013 |
| Percentage of illicit drug users who call ambulance within a year | 1.5% | In Devon in 2010, there were 1 485 ambulance callouts relating to drug overdoses (NHS Devon, 2012). If we assume that 8.2% of the population of Devon use illicit drugs, then the callouts for drug overdoses over a year represent 1.5% of illicit drug users |
| Percentage of those who abuse alcohol who call ambulance within a year | 0.4% | In Devon in 2010, there were 1 191 callouts relating to alcohol overdoses (NHS Devon, 2012). If we assume that 24% of the population of Devon abuse alcohol, then the callouts for alcohol overdoses over a year represent 0.4% of those who abuse alcohol |
| Other factors | ||
| Percentage of adult mental health service users who use ambulance service each month | 3.51% | 78% of users of adult mental health services attend hospital at least once in a year (assume 6.5% each month), and 54% of those who arrive at A&E arrive by ambulance or helicopter (Health and Social Care Information Centre, 2012) |
| Percentage of calls from schools for ambulance attendance deemed ‘avoidable’ | 47% | SWAST |
| Percentage of calls from police or prison service for ambulance attendance deemed ‘avoidable’ | 35% | SWAST |
| Number of calls per month from patients who have been treated at scene and discharged within previous 24 hours | 1 147 | SWAST |
| Number of calls per month from patients deemed ‘inappropriate’ for ambulance attendance | 888 | SWAST |
| Number of calls per month referred from 111 Service | 2325 | SWAST |
| Number of calls per month to attend large-scale public events | 22 | SWAST |
Calculating the rate of ambulance calls
In order to calculate the number of people who call an ambulance each month in the model, we calculate the sum of all factors that directly influence ambulance demand. It is important to note that the resultant rate of ambulance calls per month is likely to underestimate reality because the model does not take into account all of the originally identified factors that influence ambulance demand. However, this approach is very useful in helping us to identify which factors might be the most influential among those included in the model, and the results of this analysis should be interpreted accordingly.
Testing and ranking influences on demand
In order to establish which factors most influence levels of ambulance demand, we systematically removed each influencing factor included in the model in turn (such that only one factor was removed at any time), and recorded the difference in total demand in the simulation after 12 months compared to the base case scenario, in which all influencing factors are included.
Results
The model predicts that the number of regular fallers among older people is the most influential contributor to demand for ambulances in South West England. This factor is predicted to be over three times more influential than referrals from the 111 service. Furthermore, the majority of the 10 most influential factors predicted by the model are directly related to falls among older people. The proportion of the population who are users of adult mental health services is also predicted to significantly influence demand for ambulance services.
Table 2 shows the full list of factors in order of their estimated influence on ambulance demand, along with the absolute magnitude of the difference in predicted ambulance demand, as compared with the base case.
| Rank | Influencing factor | Absolute magnitude of difference in demand from base case |
|---|---|---|
| 1 | Number of people who are regular fallers | 34.3% |
| 2 | Initial older people population size | 28.8% |
| 3 | Proportion of older people limited a lot by disability | 26.4% |
| 4 | Proportion of ‘limited a lot by disability’ sub-population who regularly fall | 26.4% |
| 5 | Proportion of population who are users of adult mental health services | 21.2% |
| 6 | Number of adult mental health users who are ambulance users per month | 21.2% |
| 7 | Number of calls referred from 111 service per month | 10.5% |
| 8 | Proportion of older people limited a little by disability | 8% |
| 9 | Proportion of ‘limited a little by disability’ sub-population who regularly fall | 8% |
| 10 | Proportion of population using minor injury units per month | 5.7% |
| 11 | Number of calls referred from minor injury units per month | 5.7% |
| 12 | Number of road traffic accidents per month | 5.6% |
| 13 | Number of people who call an ambulance more than once within 24 hours per month | 5.2% |
| 14 | Number of ‘frequent callers’ per month | 4.0% |
| 15 | Number of chronic condition patients needing medical attention per month | 4.0% |
| 16 | Number of chronic condition sufferers using ambulance per month | 4.0% |
| 17 | Prevalence of chronic medical conditions | 4.0% |
| 18 | Number of calls for ambulance made by GPs per month | 3.6% |
| 19 | Number of drug and alcohol abuse ambulance users per month | 3.5V |
| 20 | Prevalence of chronic medical conditions among over 65s | 2.8% |
| 21 | Number of people who misuse alcohol | 1.7% |
| 22 | Number of illicit drug users | 1.7% |
| 23 | Number of calls for ambulance made by schools per month | 1.4% |
| 24 | Proportion of 16–59-year-old urban dwellers who use illicit drugs | 1.3% |
| 25 | Prevalence of chronic medical conditions among over 65s | 1.3% |
| 26 | Frequency of wet road weather conditions | 1.1% |
| 27 | Relative risk of RTC in wet road weather conditions | 1.1% |
| 28 | Appropriate calls from schools per month | 0.7% |
| 29 | Total inappropriate calls from schools per month | 0.6% |
| 30 | Proportion of 16–59-year-old rural dwellers who use illicit drugs | 0.5% |
| 31 | Number of calls for ambulance made by prisons or police per month | 0.4% |
| 32 | Number of people without transport | 0.4% |
| 33 | Number of people with no transport who use ambulance per month | 0.4% |
| 34 | Growth rate in population of older people | 0.3% |
| 35 | Appropriate calls form police per month | 0.3% |
| 36 | Proportion of population living alone | 0.2% |
| 37 | Proportion of one person households without a car | 0.2% |
| 38 | Percentage of region which is rural | 0.2% |
| 39 | Total inappropriate calls from police or prison service per month | 0.2% |
| 40 | Proportion of males in population | 0.1% |
| 41 | Number of calls made from large-scale public events per month | 0.1% |
| 42 | Frequency of extreme cold weather conditions | 0.1% |
| 43 | Relative risk of RTC in cold weather conditions | 0.1% |
| 44 | Net migration into region | 0.1% |
| 45 | Number of calls referred from NHS walk in centres per month | 0% |
| 46 | Proportion of patients able to see GP within a week | 0% |
| 47 | Proportion of people using the internet for health information | 0% |
| 48 | Proportion of internet ‘self-diagnosers’ who increase GP visits | 0% |
| 49 | Proportion of males without cars | 0% |
| 50 | Proportion of females without cars | 0% |
| 51 | Proportion of people over 65 who do not own a car | 0% |
| 52 | Proportion of people who live alone who are 65 or over | 0% |
| 53 | Median income as proprotion of non-recession income | 0% |
| 54 | Proportion of people at lowest income level who do not own a car | 0% |
| 55 | Proportion of people at highest income level who do not own a car | 0% |
| 56 | Proportion of people with mental health problems who abuse substances | 0% |
Discussion
The results of our model strongly suggest that the prevalence of regular fallers among older people has a significant impact on demand for ambulance services in South West England, and would appear to be more influential than other known sources of high demand, such as the introduction of the 111 telephone service (a service run by the NHS to provide advice to those with an urgent but non-life threatening medical need). This would suggest that the uptake of and adherence to falls prevention strategies, such as the guidance published by the National Institute for Health and Care Excellence (2014), could significantly reduce ambulance demand if such strategies are effective.
While it is difficult to speculate about the absolute magnitude of the reduction in ambulance demand that could be achieved if the prevalence of falls was reduced, the results of the model show that the number of people who are regular fallers, along with the associated size of the older people population and the proportion of older people who are ‘limited a lot’ by their disability, are far more influential on the total level of ambulance demand than the other factors considered by the model.
Additionally, we know that in 2012 SWAST received an average of 7 094 calls per month that were coded as ‘falls’, which represents 10.94% of the 64 822 average calls per month received by SWAST that year. Furthermore, this is likely to underestimate the true number of ambulance calls related to falls, because many paramedics code the case according to the injury sustained as a consequence of the fall, rather than the fall itself (local clinical opinion).
The model also predicts that ambulance use among those with mental health problems could be significant, primarily because they are more likely to call for an ambulance or seek emergency medical attention for incidents for which this level of response may not be appropriate (Larkin et al, 2006). This population also has higher rates of alcohol abuse and illicit drug use (Mental Health Foundation, 2007), but this is not predicted by our model to influence ambulance demand as significantly, being over six times less influential. Therefore, efforts to identify and address the reasons why those with mental health problems may use ambulance services inappropriately could be very beneficial in terms of reducing overall demand for ambulance services.
Limitations
It should be reiterated that there are known factors that might influence ambulance demand that our model does not capture, largely because we were unable to find a quantitative relationship or suitable proxy to capture these influences. Also, it is likely that there are other factors not considered in this study that might influence demand for ambulance services. As such, our results should be interpreted in the context of their importance relative to the other influencing factors included in the model. However, we are confident that the combination of our literature review and expert opinion from SWAST has yielded at least the key influences on ambulance demand.
It should be noted that, given the range and volume of data sources used to parameterise the model, uncertainties in the estimates derived from the various studies we have used could be compounded, leading to inaccuracies in our results. However, it should be emphasised that the purpose of this model is not to predict the reduction in the number of ambulance calls that would be made if certain influencing factors were removed, but rather to provide a general sense of how these influences compare to each other. In this sense, it is important not to interpret our results as precise quantitative predictions.
Furthermore, a number of those influences that were dropped from the model after being identified during the initial literature review or after consultation with SWAST were removed because subsequent evidence indicated that there was no impact on ambulance demand. For example, the presence of health promotion campaigns is not considered to have an impact on ambulance demand because evidence suggests that even large-scale campaigns, such as the ‘FAST’ campaign for stroke, have had minimal or no impact on demand for ambulance services (Lecouturier et al, 2010). Other studies have found that there is no statistically significant effect on GP demand resulting from the use of NHS walk-in centres (Chalder et al, 2003), and therefore the use of such Walk-in Centres is unlikely to significantly impact overall GP capacity.
It is possible that our prediction that falls is the biggest contributing factor to demand for ambulance services may be unique to the study population of South West England. The South West is a largely rural region with a significant population of older people (Office for National Statistics, 2011), and in more urban regions, with younger demographics, it is possible that there are other factors that have a bigger influence on ambulance demand than fall rates. On the other hand, we are observing an increasing ageing society globally (Cohen, 2003). Therefore, unique clinical issues associated with an ageing population are becoming increasingly relevant everywhere, and our predictions could have more general applicability in this context.
Conclusions
Our findings suggest that falls among older people and access of ambulance services by those with mental health needs may be significantly contributing to overall demand for ambulance services. At the least, we would encourage other ambulance Trusts to use such methods as we have presented in this study to establish the reasons behind increasing demand in their own areas.