
In two previous articles, I explored the issues around rising unscheduled demand for healthcare services, and whether outbreaks of a new type of infectious disease may be, in some way, implicated (Jones 2014a, 2015a). In this respect, a further outbreak of this agent occurred during 2016, and unusually high workload during the winter of 2016/17 had already been predicted (Jones 2016e).
This update will focus on the trends in deaths as a proxy for the rising health service demand over the last weeks of life. It has been known for many years that the majority of a person's lifetime acute utilisation (up to 55%) occurs in the last year of life, and more specifically in the last 22 weeks of life (Beeknoo and Jones, 2016). Hospital admissions (and ambulance journeys) reach a crescendo in the last month of life. However, this occurs irrespective of the age at death, i.e. it is a fundamental biological process of deterioration resulting in functional, cognitive and biochemical decline (Beeknoo and Jones, 2016; Jones et al, 2016); hence, the trend in deaths will be highly indicative of the pressure on ambulance services.
Trend in deaths
Figure 1 compares the trend in deaths in England with those solely in Milton Keynes (as an example). A running 12-month total has been used to remove the effect of seasonality. As such, the saw-tooth patterns seen in the trends should not exist. Indeed, there is no official recognition by any government agency regarding this peculiar behaviour. In a running 12-month total, such saw-tooth behaviour can only arise when deaths switch on/off in a recurring high/low pattern. In the ‘high’ part of the pattern, deaths are consistently high for a 12-month period, after which they switch back to the ‘low’ or baseline state. In the period 2001 to 2012, total deaths in England were declining and this decline has masked several of the saw-tooth features. On the other hand, deaths in Milton Keynes have been increasing since this was a new town constructed in the late 1960s. The saw-tooth features are therefore easier to discern, especially for that leading to 12-months of higher deaths in 2005. As can be seen, Milton Keynes is affected to a different degree compared with the England average during these events, as are all local authority areas in the UK (Jones, 2015d). These differences arise due to the spread of the agent through the small social networks within the larger areas (Jones 2015b; 2016c). Also discerned from Figure 1 is a slightly earlier initiation of the 2016 outbreak in Milton Keynes compared with the England average.
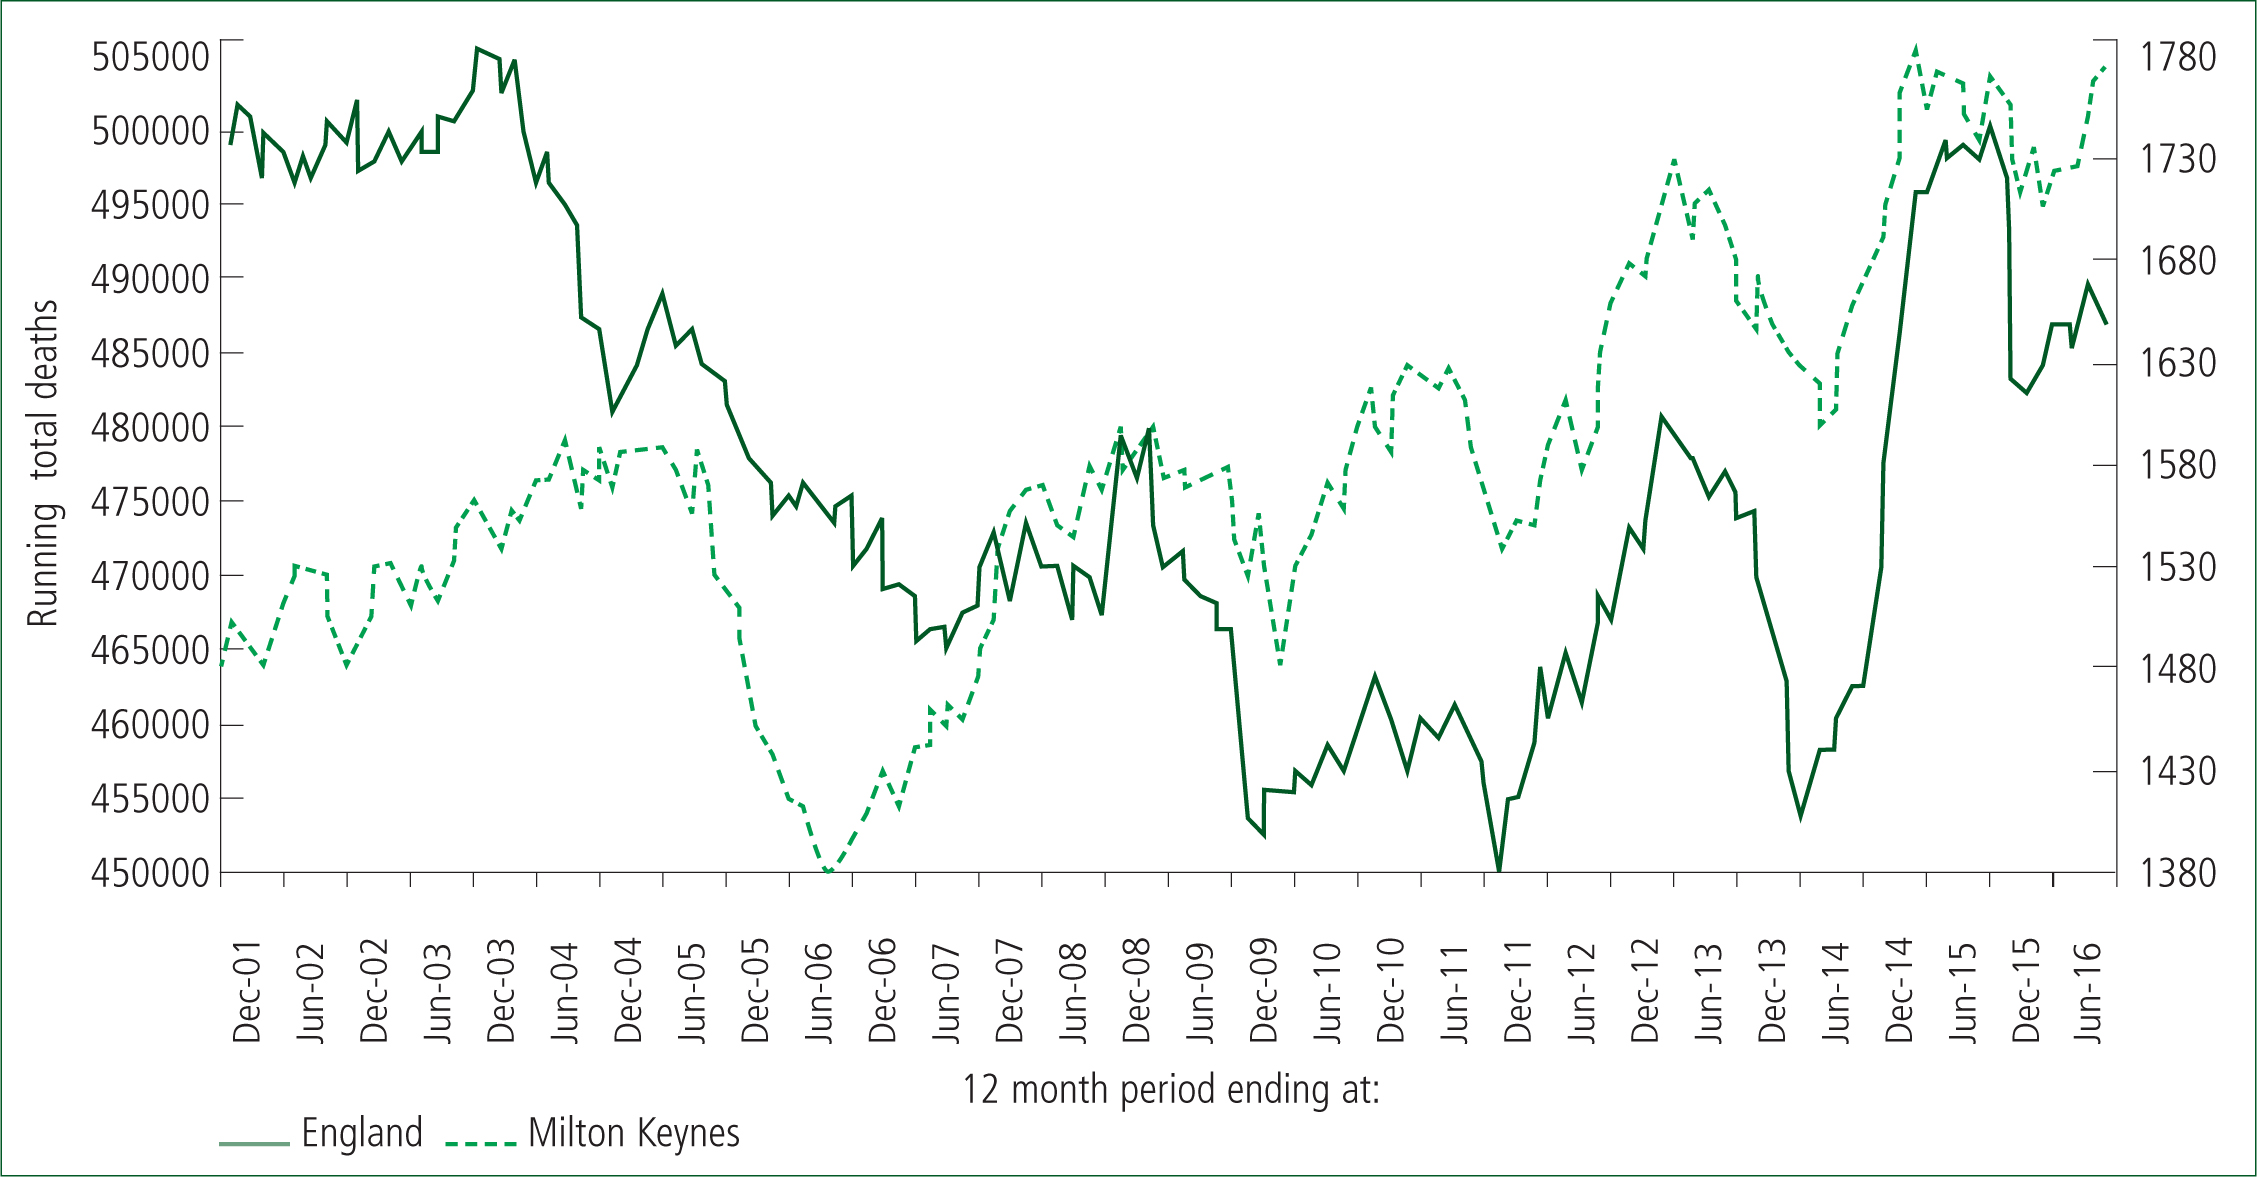
According to official Office for National Statistics (ONS) projections, deaths should be somewhere around 455 000 (Jones, 2016a), but are clearly much higher. The large peak which starts in 2014 and continues into 2015 seemingly arises from the interaction between the proposed infectious agent and influenza (Jones, 2016b). Beyond December 2016, the running total was supposed to go back to a baseline of around 455 000, but does not do so. Matters are then made worse by another outbreak of the proposed agent in early 2016 (Jones, 2016d), and Milton Keynes is affected worse than the England average. During all outbreaks, persons with Alzheimer's and dementia suffer the highest loss of life (Jones, 2016a).
From Figure 1, it can therefore be deduced that workload this winter is going to remain unremittingly high, especially in case of an influenza outbreak like in January 2015. Based on early results from the southern hemisphere, a major influenza event looks possible (Filleul et al, 2016); however, as of the second week in January, influenza activity is still relatively low (Public Health England 2017).
Magnitude of the 2016 event
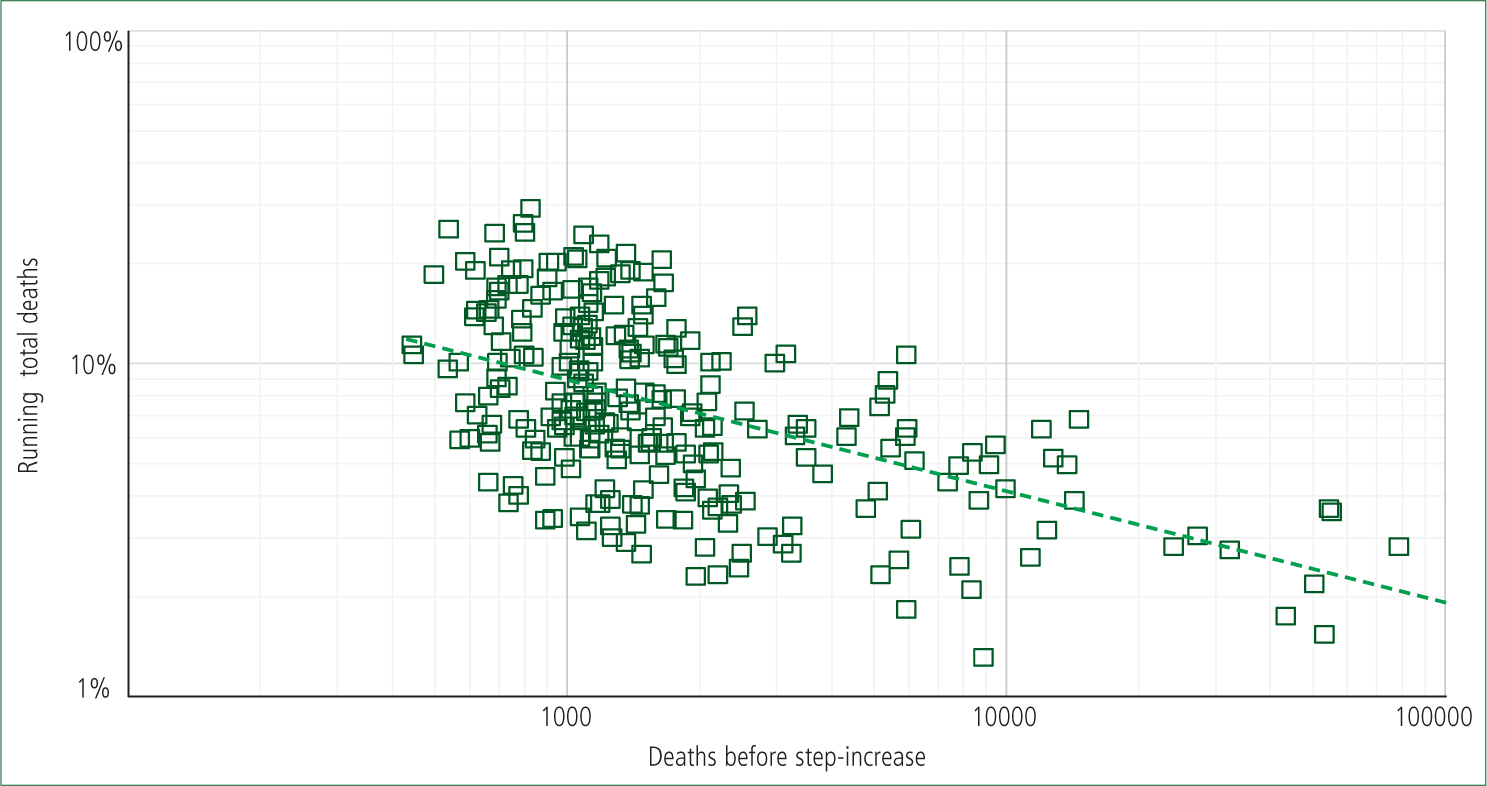
In Figure 2, the magnitude of the 2016 outbreak has been measured for local authority areas in England and Wales. ONS data was available up to November 2016 and the slope of the upward part of the saw-tooth has been used to evaluate the magnitude of the step-increase in deaths. As can be seen, the increase in deaths in a typical local authority ranges from 3%–30%. The wide range of increase in deaths is due to infectious heterogeneity, i.e. the infection travels along social networks, and hence affects variable numbers of people; especially those prone to death. The increase in deaths in London, which is populated with a greater population of young people, is typically only modest. In Figure 2, some 70% of local authority areas had experienced a statistically significant step-increase by October-16, the remaining 30% (many from London) being absent from Figure 2. An additional reason that London is affected less is that there is outward migration as people reach retirement age, and end-of-life care is transferred to typical retirement locations out of the city.
Note that staff sickness absence also increases in the same step-like manner during these events (Jones, 2015c), as do A&E attendances and medical admissions (Jones, 2015c; 2016d, e). It would appear that this infectious agent likes to, as it were, kick you when you are down. Hence, from Figure 2, we deduce that workload pressures between locations are likely to be highly variable with hot spots, through to ‘not a lot happening here’.
Effect on emergency admissions
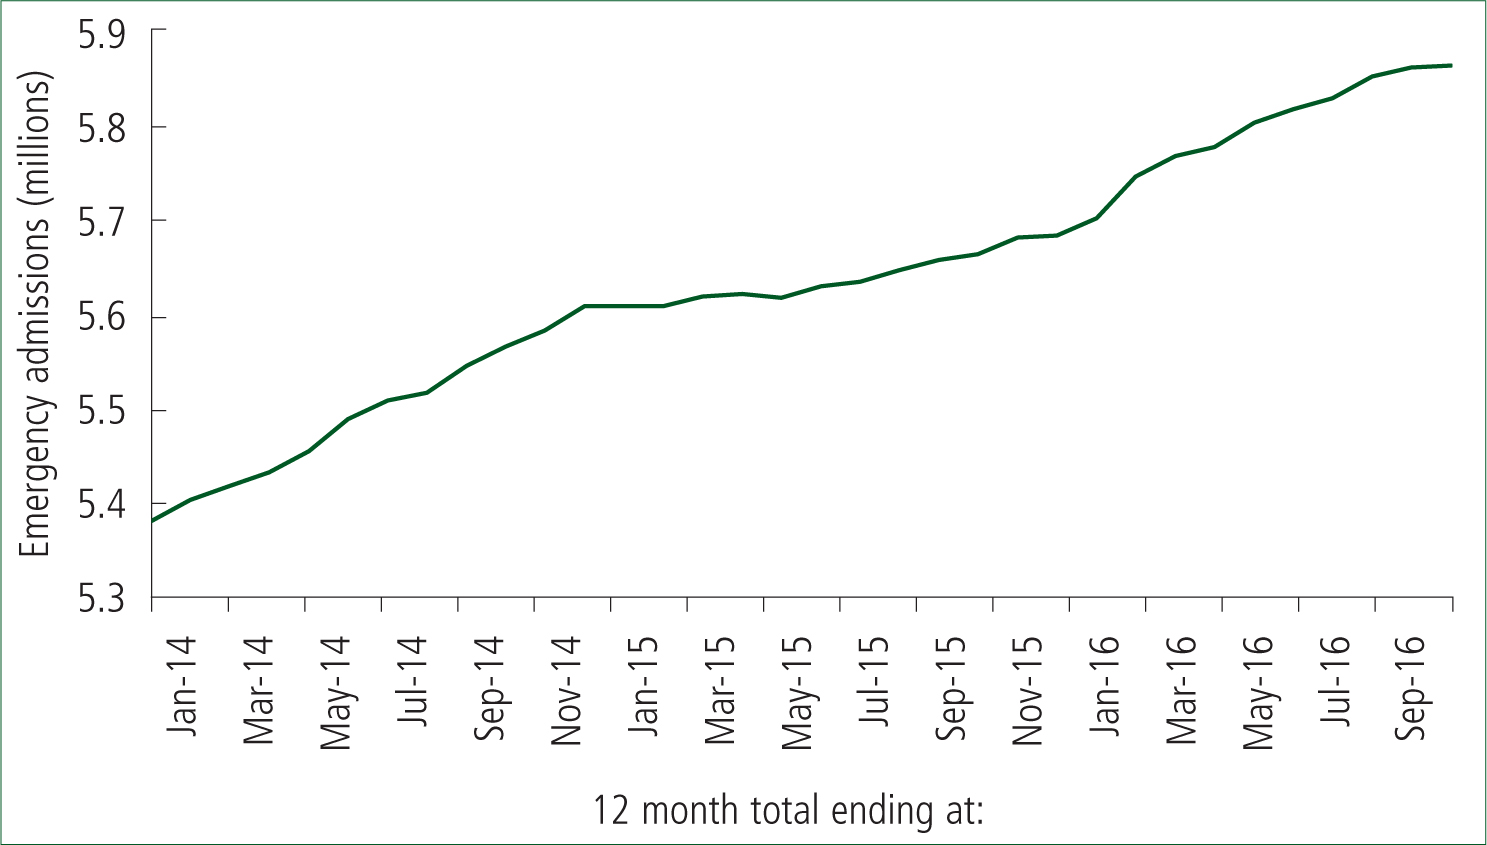
Having established that a sudden step-like increase in deaths has occurred, Figure 3 demonstrates that a matching step-like increase in emergency admissions has likewise occurred in early 2016, as it did in early 2014 (Jones, 2015a–d). Recall that in a running 12-month total, the step-increase in emergency admissions (and ambulance demand) occurs at the foot of the ramp, i.e. demand has already been running high for most of the year and continued to do so into the winter of 2016/17.
Given that the agent leading to these step-like increases in deaths and admissions appears able to interact with influenza (Jones, 2016f), an influenza outbreak in early 2017 would only create a further increase in demand in addition to demand due to influenza alone.
A likely agent
Based on the spectrum of conditions affected during these events, it has been proposed that the ubiquitous immune modifying herpes virus (Cytomegalovirus) is likely to be involved (Jones, 2016c). Via immune manipulation, this virus appears to exacerbate existing medical conditions, and increases susceptibility to infection, especially for respiratory conditions (Jones, 2014b).
Unravelling cause and effect
Many seemingly have an opinion regarding why the 2016/17 winter has been so demanding for paramedics. Figures 1–3 have already demonstrated that an unprecedented step-increase in demand had occurred earlier in 2016. This is the primary cause. Secondary causes arise from the already dangerously high bed occupancy (Beeknoo and Jones, 2016), leading to issues such as access block in A&E and trolleys in the corridor. The 2014 outbreak and subsequent interaction with an influenza outbreak in January 2015 led to higher than expected emergency admissions throughout 2015 (Jones, 2016f), thereby providing a higher base for the 2016 outbreak. This has exacerbated already stretched staffing resources in A&E, i.e. a secondary contributory factor.
Conclusions
For something which does not officially exist, the ability to kill seemingly large numbers of persons is concerning, as is the complete lack of public health measures. For whatever reason, Whitehall remains silent over this issue. For the moment it seemingly remains politically expedient to continue to blame the health services.