

Last February, I presented evidence to suggest that the trends in demand for urgent care were highly unusual, and may be due to a new type of infectious event (Jones, 2014a). Since that time, further research has revealed that this infectious-like event has occurred in an unprecedented four-in-a-row time series in 2008, 2010, 2012 and 2014, and is international in scope (Jones, 2015d, i). These events affect deaths, A&E attendances, medical admissions, bed occupancy, sickness absence and GP referral (Jones, 2014b–d; 2015c,d,i,m), and have a characteristic mix of increased death and medical admission for conditions which are sensitive to immune function (Jones, 2014a–c; 2015a–j, Jones and Goldeck, 2014). Analysis of a time series of deaths in England and Wales shows that since the 1950s these events typically occur twice per decade (Jones, 2015c, e), except for another cluster in the 1990s (1993, 1996, 1999, 2002) (Jones, 2015b, d).
Further analysis of medical admissions using very small spatial areas has demonstrated spatiotemporal spread, which is a typical characteristic of an infectious event (Jones, 2014c; 2015g, h, n; Jones and Beauchant, 2015). On this occasion, the presumed infectious event behaves like a rectangular wave, i.e. at the onset of the event A&E attendances, medical admissions, etc. all show a sudden step-like increase (Jones, 2015p). This increase endures for around 12 months before suddenly abating.
With this information in mind, re-analysis of some key trends is now possible. The following analysis uses a running 12-month total to detect the characteristic step-like changes. In a running total the onset of a step-increase leads to the initiation of a ramp. The slope of the ramp reflects the size of the step change and the full magnitude of the step change becomes apparent 12 months into the running total. A similar situation occurs in reverse for a step-down in activity. Due to the fact that A&E attendances and medical admissions are highly seasonal, a running total also has the advantage that it effectively de-seasonalises the trend.
Figure 1 , therefore, presents running total trends in A&E attendances for various patient age bands. Due to the differences in attendances by age band, each one has been adjusted relative to the point of minimum attendances. As can be seen, different age bands are growing at different rates—none of which reflect underlying demographic change (Jones, 2014b; 2015a, j). However, of greatest importance are the undulations in the running 12-month totals, all of which correspond with the start dates of the proposed infectious events. Indeed, in the age 0–16 and 17–39 year age bands there is evidence that the step-down following the 2012 event actually leads to a reduction in total attendances, which is then overwhelmed by the ensuing 2014 event. Each event has an age-specific effect leading to higher relative growth in certain age bands during the different events.
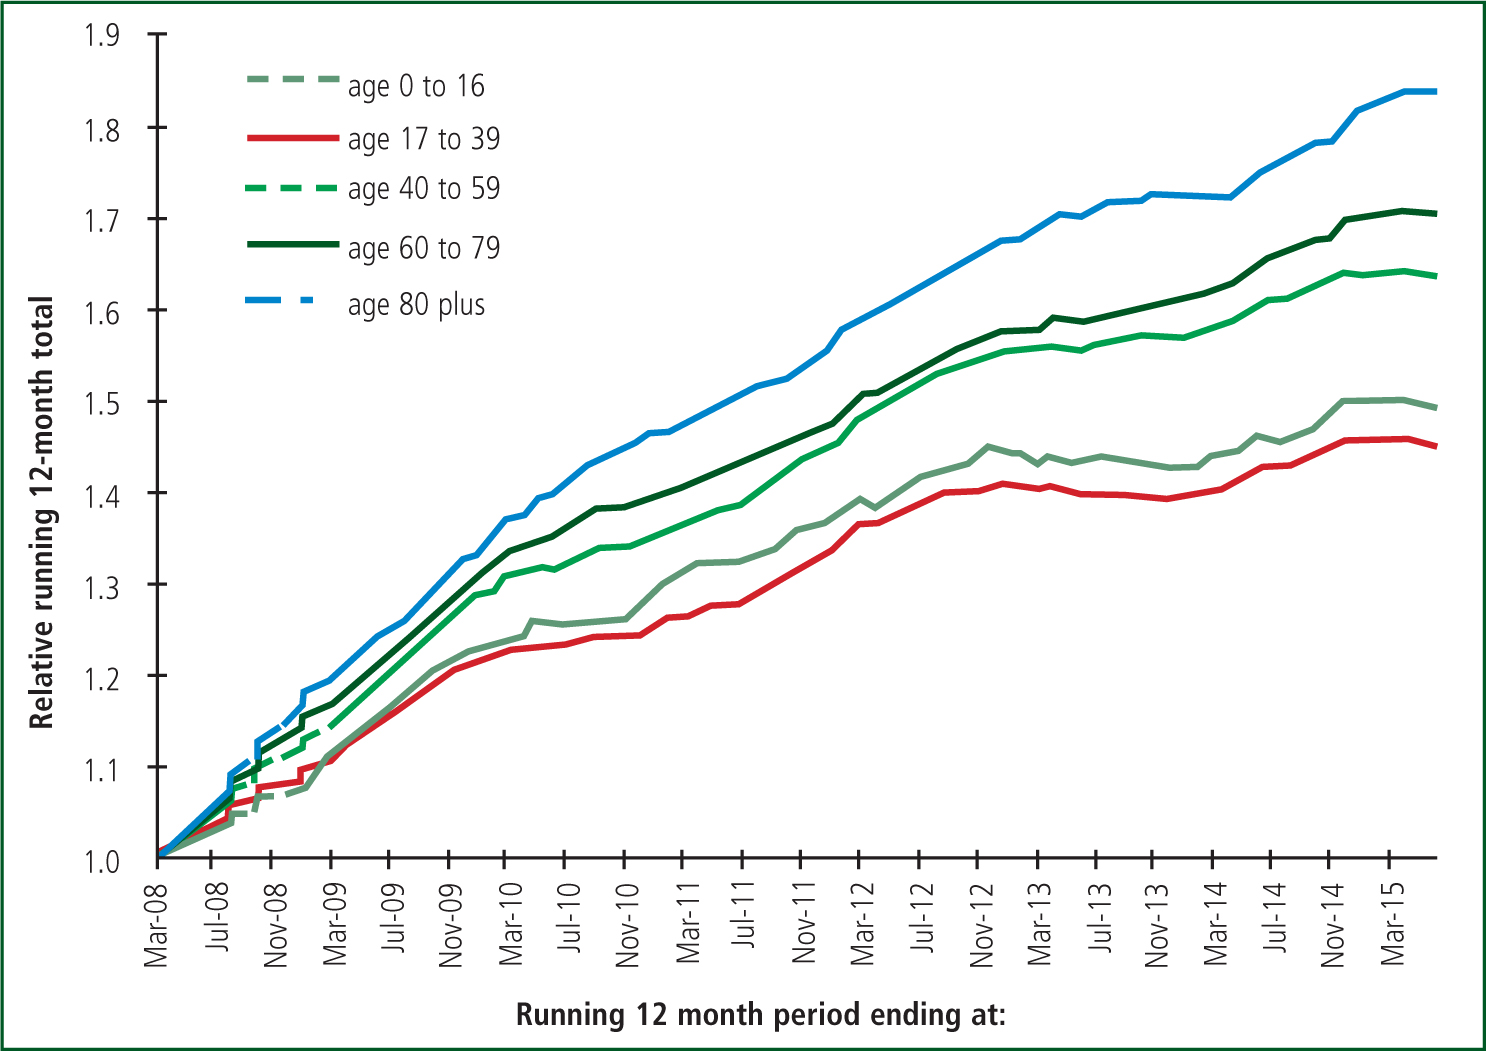
It is key to note that it is the sheer magnitude of these events which is driving growth rather than the underlying background growth due to demographic change, and slow incremental increase in the use of emergency services in general.
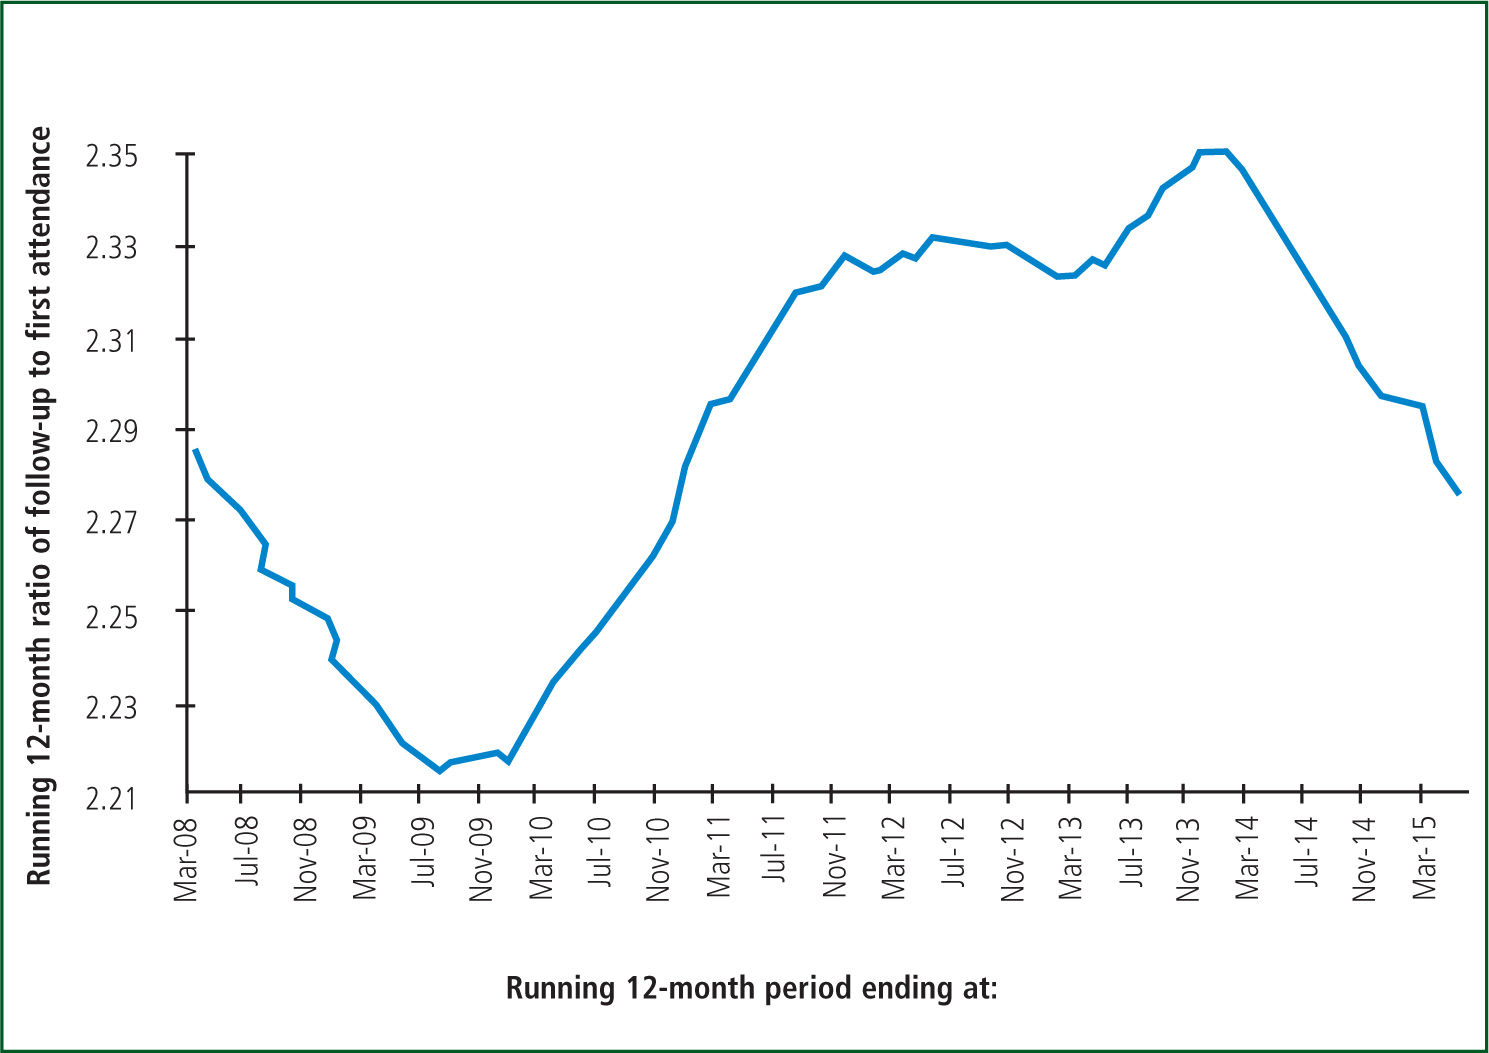
In order to demonstrate that this is not something unique to A&E attendances, Figure 2 shows the impact of these events on the ratio of follow-up to first outpatient attendances. As can be seen the 2008, 2010, 2012 and 2014 events all have their own characteristic effect of the underlying outpatient case mix leading to unique changes in the ratio of follow-up to first attendances. Note there will be a slight lag in Figure 2 relative to Figure 1 due to the delay between GP referral and eventual first attendance at outpatients, and then a further lag as these attendances then convert to follow-up appointments. A similar lag is observed between A&E attendances, medical admissions and deaths, simply due to the fact that illness precedes eventual death (Jones, 2015f; 2016).
‘It is the sheer magnitude of these events which is driving growth rather than the underlying background growth due to demographic change, and slow incremental increase in the use of emergency services in general’
As readers will be aware, it is current Government policy to blame the respective health service organisations for the outcome of these events. Hence, ambulance services are blamed for carrying too many people to A&E, hospitals are blamed for admitting too many medical patients, GPs are blamed for not working 7 days a week. Clearly the evidence for these infectious-like events and their impact on health service demand is a political inconvenience and the research is seemingly being ignored by all Government agencies (who are tasked with implementing policy and also of providing policy-based evidence).
Clearly these events appear to be infectious; however, even if they are not, they should be investigated and the huge amount of evidence should be allowed to shape future research. These events are so big that to ignore them is the equivalent to sticking one's policy head very firmly deep in the sand, and of ignoring a huge potential public health threat.