
Injuries continue to be a major public health concern and are a leading cause of death and ill health among children worldwide. Globally, an estimated 644 855 children aged 0–14 years died because of injury in 2016 (World Health Organization (WHO), 2018a), and many more children sustain non-fatal injuries that can have long-term effects on their physical, psychological and social development (Peden et al, 2008; Sethi et al, 2008). This is costly to the healthcare system and society because of disability and inability to work.
However, many injuries are avoidable and preventing child injury is a global public health priority (Krug et al, 2000; Peden et al, 2008; Sethi et al, 2008; WHO, 2014). Effective prevention strategies require information so the extent and characteristics of injury, the populations at risk and what resources are required, and where and when they should be targeted, can be understood. This can be supported through effective injury surveillance systems, and the availability and use of health data intelligence (Holder et al, 2001).
Child injury is a burden on health services in England, so monitoring its extent is a priority of Public Health England (PHE). Hospital admissions caused by injuries in children aged 0–14 years is a key national indicator for assessing the public's health, and more than 100 000 admissions were reported between April 2016 and March 2017 (PHE, 2018).
In addition to hospital admissions data, a variety of research studies illustrate the value of other health data sources in understanding and monitoring childhood injury, particularly mortality and emergency department (ED) attendance data sources (Zuckerbraun et al, 2004; Edwards et al, 2008; Sanchez et al, 2010; Espitia-Hardeman et al, 2011; Quigg et al, 2012; Hughes et al, 2014; Baker et al, 2016). Such data sources are used in various regional and national injury surveillance systems, such as the Trauma and Injury Intelligence Group in England (Quigg et al, 2012), the All Wales Injury Surveillance System (Lyons et al, 2016), the National Electronic Injury Surveillance System in the US (Nelson et al, 2011) and the Canadian Hospitals Injury Reporting and Prevention Program (Crain et al, 2016). A few studies have shown some utility in the use of ambulance service data in injury surveillance; while not solely focused on children, they indicate that such data could also be used to develop the understanding and monitoring of injury at local and regional levels (Backe and Andersson, 2008; Thomas et al, 2011; Quigg et al, 2017).
There are 10 ambulance trusts in England, which provide accident and emergency services to people in need of medical treatment and transport 24 hours per day, 365 days per year. The demand for urgent and emergency ambulance services is rapidly increasing, while funding and staff recruitment and retention are not meeting the rising demand (National Audit Office, 2017). Each trust holds its own data collection system; only a subset of aggregated data are collected at a national level.
Using data from one trust (North West Ambulance Service NHS Trust (NWAS)), the authors of this study aimed to explore the potential utility of ambulance call-out data in child injury surveillance. They examined the nature and extent of child injury ambulance call-outs in the north west of England and its burden on the ambulance service, and consider the utility of the data in informing child injury prevention.
Methods
Study design and setting
This is a cross-sectional examination of injury-related ambulance call-outs for children aged 0–14 years in the north west of England between April 2016 and March 2017.
Data collection
All emergency calls are answered by an operator, who asks which emergency service is required. Once connected to the ambulance service, an emergency medical dispatcher asks for the location of the emergency and gathers information about the problem to determine the priority of the emergency and type of response required, using the Medical Priority Dispatch System (MPDS).
Information is captured using a computer-aided dispatch (CAD) database system. This shares a subgroup of fields with the Trauma and Injury Intelligence Group (www.tiig.info) on a monthly basis via a secure web-based drop box (SharePoint 2013). Fields include date and time of the call, MPDS details (nature and brief description of the incident), patient age and sex, geographical area of the call-out location, and whether the patient was conveyed to another healthcare provider. No clinical records were used in the study; only the CAD data that are recorded by emergency medical dispatchers.
Participants
Where a valid age was recorded (96.1% of all cases), data were extracted on ambulance call-outs to 0–14 year-olds for the year from 1 April 2016 to 31 March 2017. The authors decided to examine records of those aged under 15 years so the results could be correlated with PHE's indicator on hospital admissions caused by injuries in children, which defines children as those aged 0–14 years (PHE, 2018). Furthermore, other child injury studies categorise children as those aged 0–14 years (Hippisley-Cox et al, 2002; Zuckerbraun et al, 2004; Edwards et al, 2006; 2008; Hughes et al, 2014). Call-outs outside of the north west of England were removed (n=348).
Outcomes of interest
NWAS uses its own data recording system which does not have the same coding system as hospital admissions data, i.e. the International Classification of Diseases and Related Health Problems (WHO, 2018b).
Initial exploration of the dataset showed that an injury may be categorised in any one of three fields that describe the nature of the call: MPDS chief complaint (e.g. fall); MPDS description (e.g. unconscious after a fall); MPDS problem (a descriptive, free-text field, e.g. fell out of high chair).
Therefore to ensure that injuries were identified in the dataset, each of these three fields were systematically searched. Based on ICD-10 codes S00-T79 and V01-Y36 (WHO, 2016), a list of over 100 words relating to injury was compiled. These words were searched sequentially across the three fields to identify call-outs related to child injury.
Each call-out was assigned an injury type based on the injury mechanism and WHO category (Krug et al, 2002; Peden et al, 2008): assault, burns (including scalds), falls, poisoning (accidental), self-inflicted injuries (i.e. self-harm, intentional poisoning), traffic injuries and other unintentional injuries (which includes categories such as choking, and animal bites and stings). Because the numbers of drownings were low (n=54), these were added to ‘other unintentional injuries’, as were call-outs where the injury mechanism was not stated but one of the three MPDS fields had a word relating to injury (i.e. contusion, laceration or wound, which are within ICD-10 codes S00-T79 and V01-Y36). Accidental poisoning was coded as ‘poisoning’ and intentional poisoning was coded as ‘self-inflicted injuries’. Any poisoning-related call-outs that did not state whether they were accidental or intentional were coded as ‘poisoning’.
Each call-out location (i.e. the lower super output area (LSOA)—these are geographical areas in England and Wales with a mean population of 1614, and are so designated to improve the reporting of small area statistics (Office for National Statistics, 2012)—was assigned a measure of deprivation using the Index of Multiple Deprivation (IMD) (Ministry of Housing, Communities and Local Government, 2015). Records were then assigned a national deprivation quintile based on the IMD value of the LSOA, as well as a rural/urban classification.
Data analysis
Data were analysed in SPSS v. 24 to explore patient and call-out characteristics (e.g. patient age and call-out location). Generalised linear modelling (GLM) was used to identify independent effects of months, weekends, English bank holidays and celebration days (Halloween and Guy Fawkes night). Estimated marginal means show the differences in these factors related to child injury ambulance call-outs. Child injury incidence rates of ambulance call-outs were estimated per 10 000 population by age, with 95% confidence intervals (CI).
Ethical considerations
This study was approved by Liverpool John Moores University Research Ethics Committee.
Findings
In 2016–2017, there were 16 285 injury-related ambulance call-outs to 0–14 year-olds in the north west of England (20.6% of all call-outs to 0–14 year-olds). The majority were unintentional injuries (91.4%). Falls were the most prevalent injury type (n=6256), followed by other unintentional injuries (n=6115), traffic injuries (n=1292), self-inflicted injuries (n=872), poisoning (n=698), assault (n=533) and burns (n=519). Incidence of child injury ambulance call-outs overall was 126.4 per 10 000 population (95% CI (124.5–128.4)); intentional injuries: 10.9 (95% CI (10.3–11.5)), unintentional injuries: 115.5 (95% CI (113.7–117.4)).
Figure 1 shows the incidence of child injury ambulance call-outs by age for all injury call-outs combined, intentional injuries and unintentional injuries. Incidence for all child injuries combined peaked at age 1 year (233.4 per 10 000 population; (95% CI (223.3–243.8)), then gradually decreased by age until 8 years, after which they increased by age. Comparatively, incidence of intentional injuries (assaults and self-inflicted injuries) at 0–7 years was low and, after the age of 7 years, incidence increased by age, peaking in those aged 14 years. Unintentional injuries followed the same pattern as all injury call-outs until the age of 8 years.
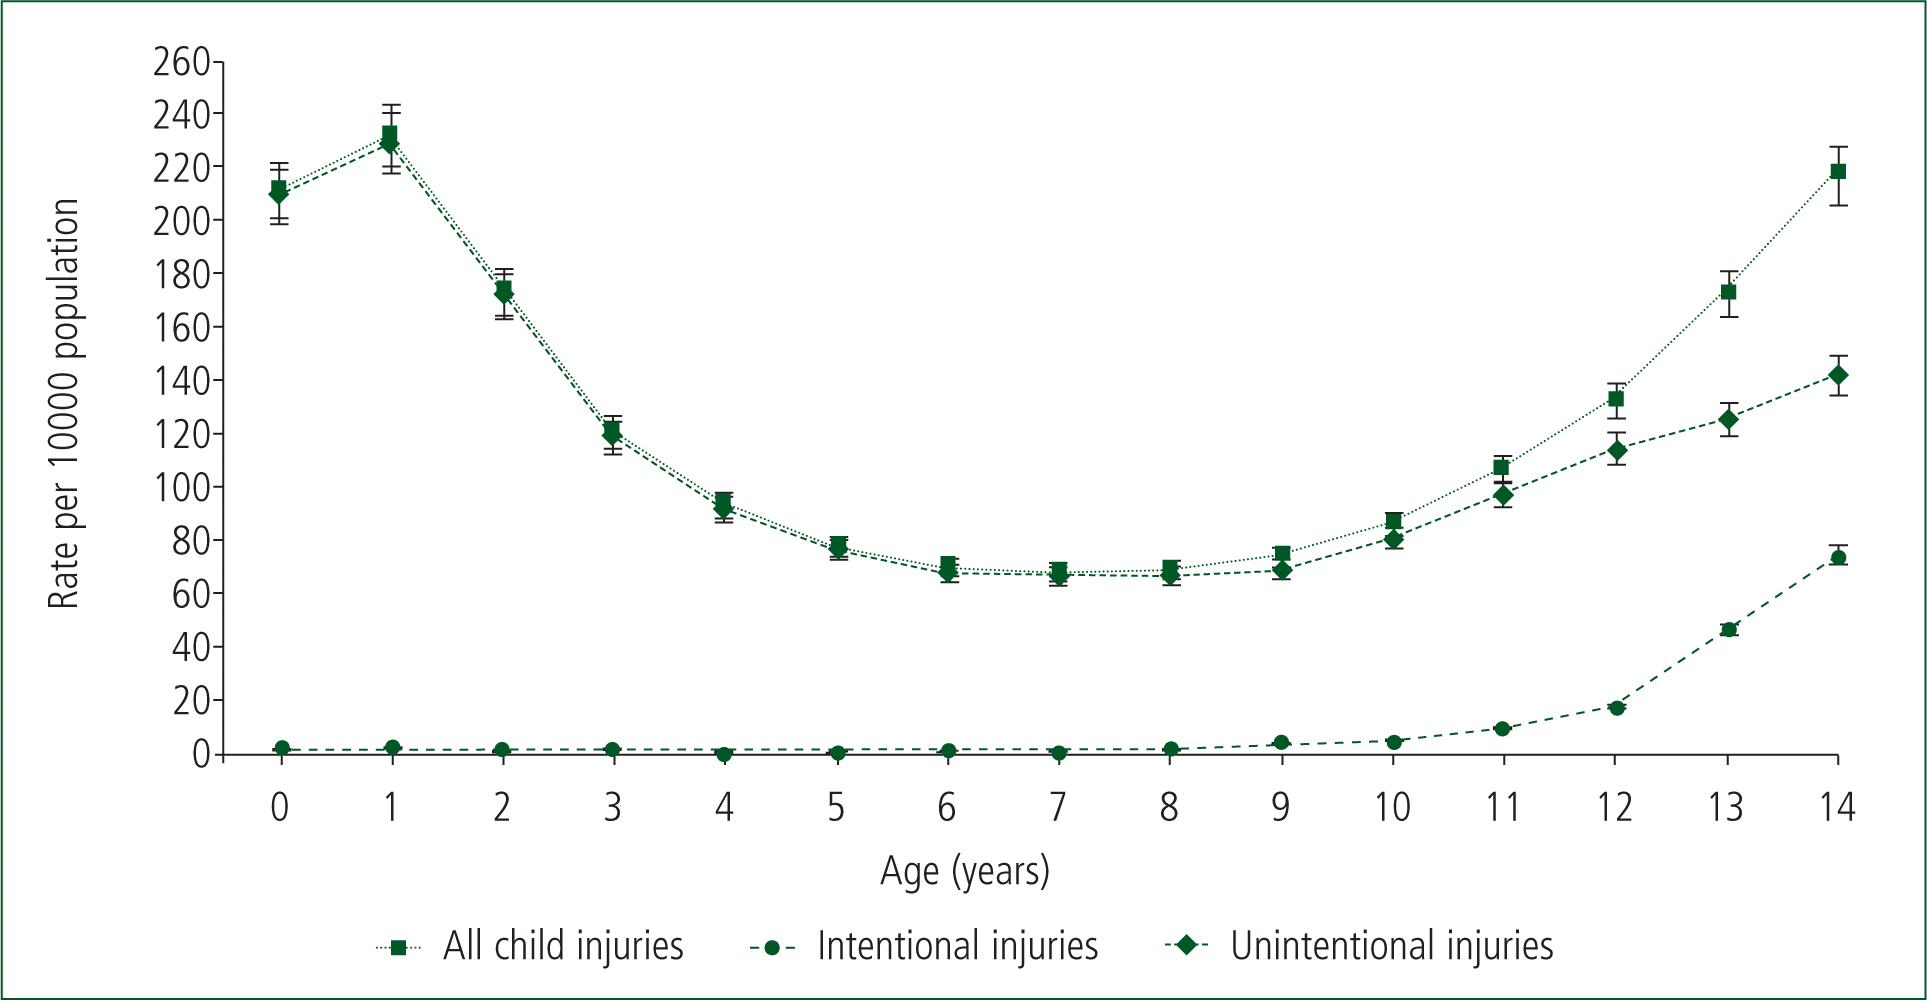
Figure 2 shows incidence of child injury ambulance call-outs for each injury type. There is a notable sharp increase in the incidence of intentional injuries above the age of 12 years, particularly for assaults. There was a small number of self-inflicted injuries recorded for 0–4 year-olds (n=19), which could be attributed to inaccurate recording of the MPDS description or the patients' age. For unintentional injuries, incidence peaked at the age of 1 year for burns and falls and at under 1 year for other injuries.
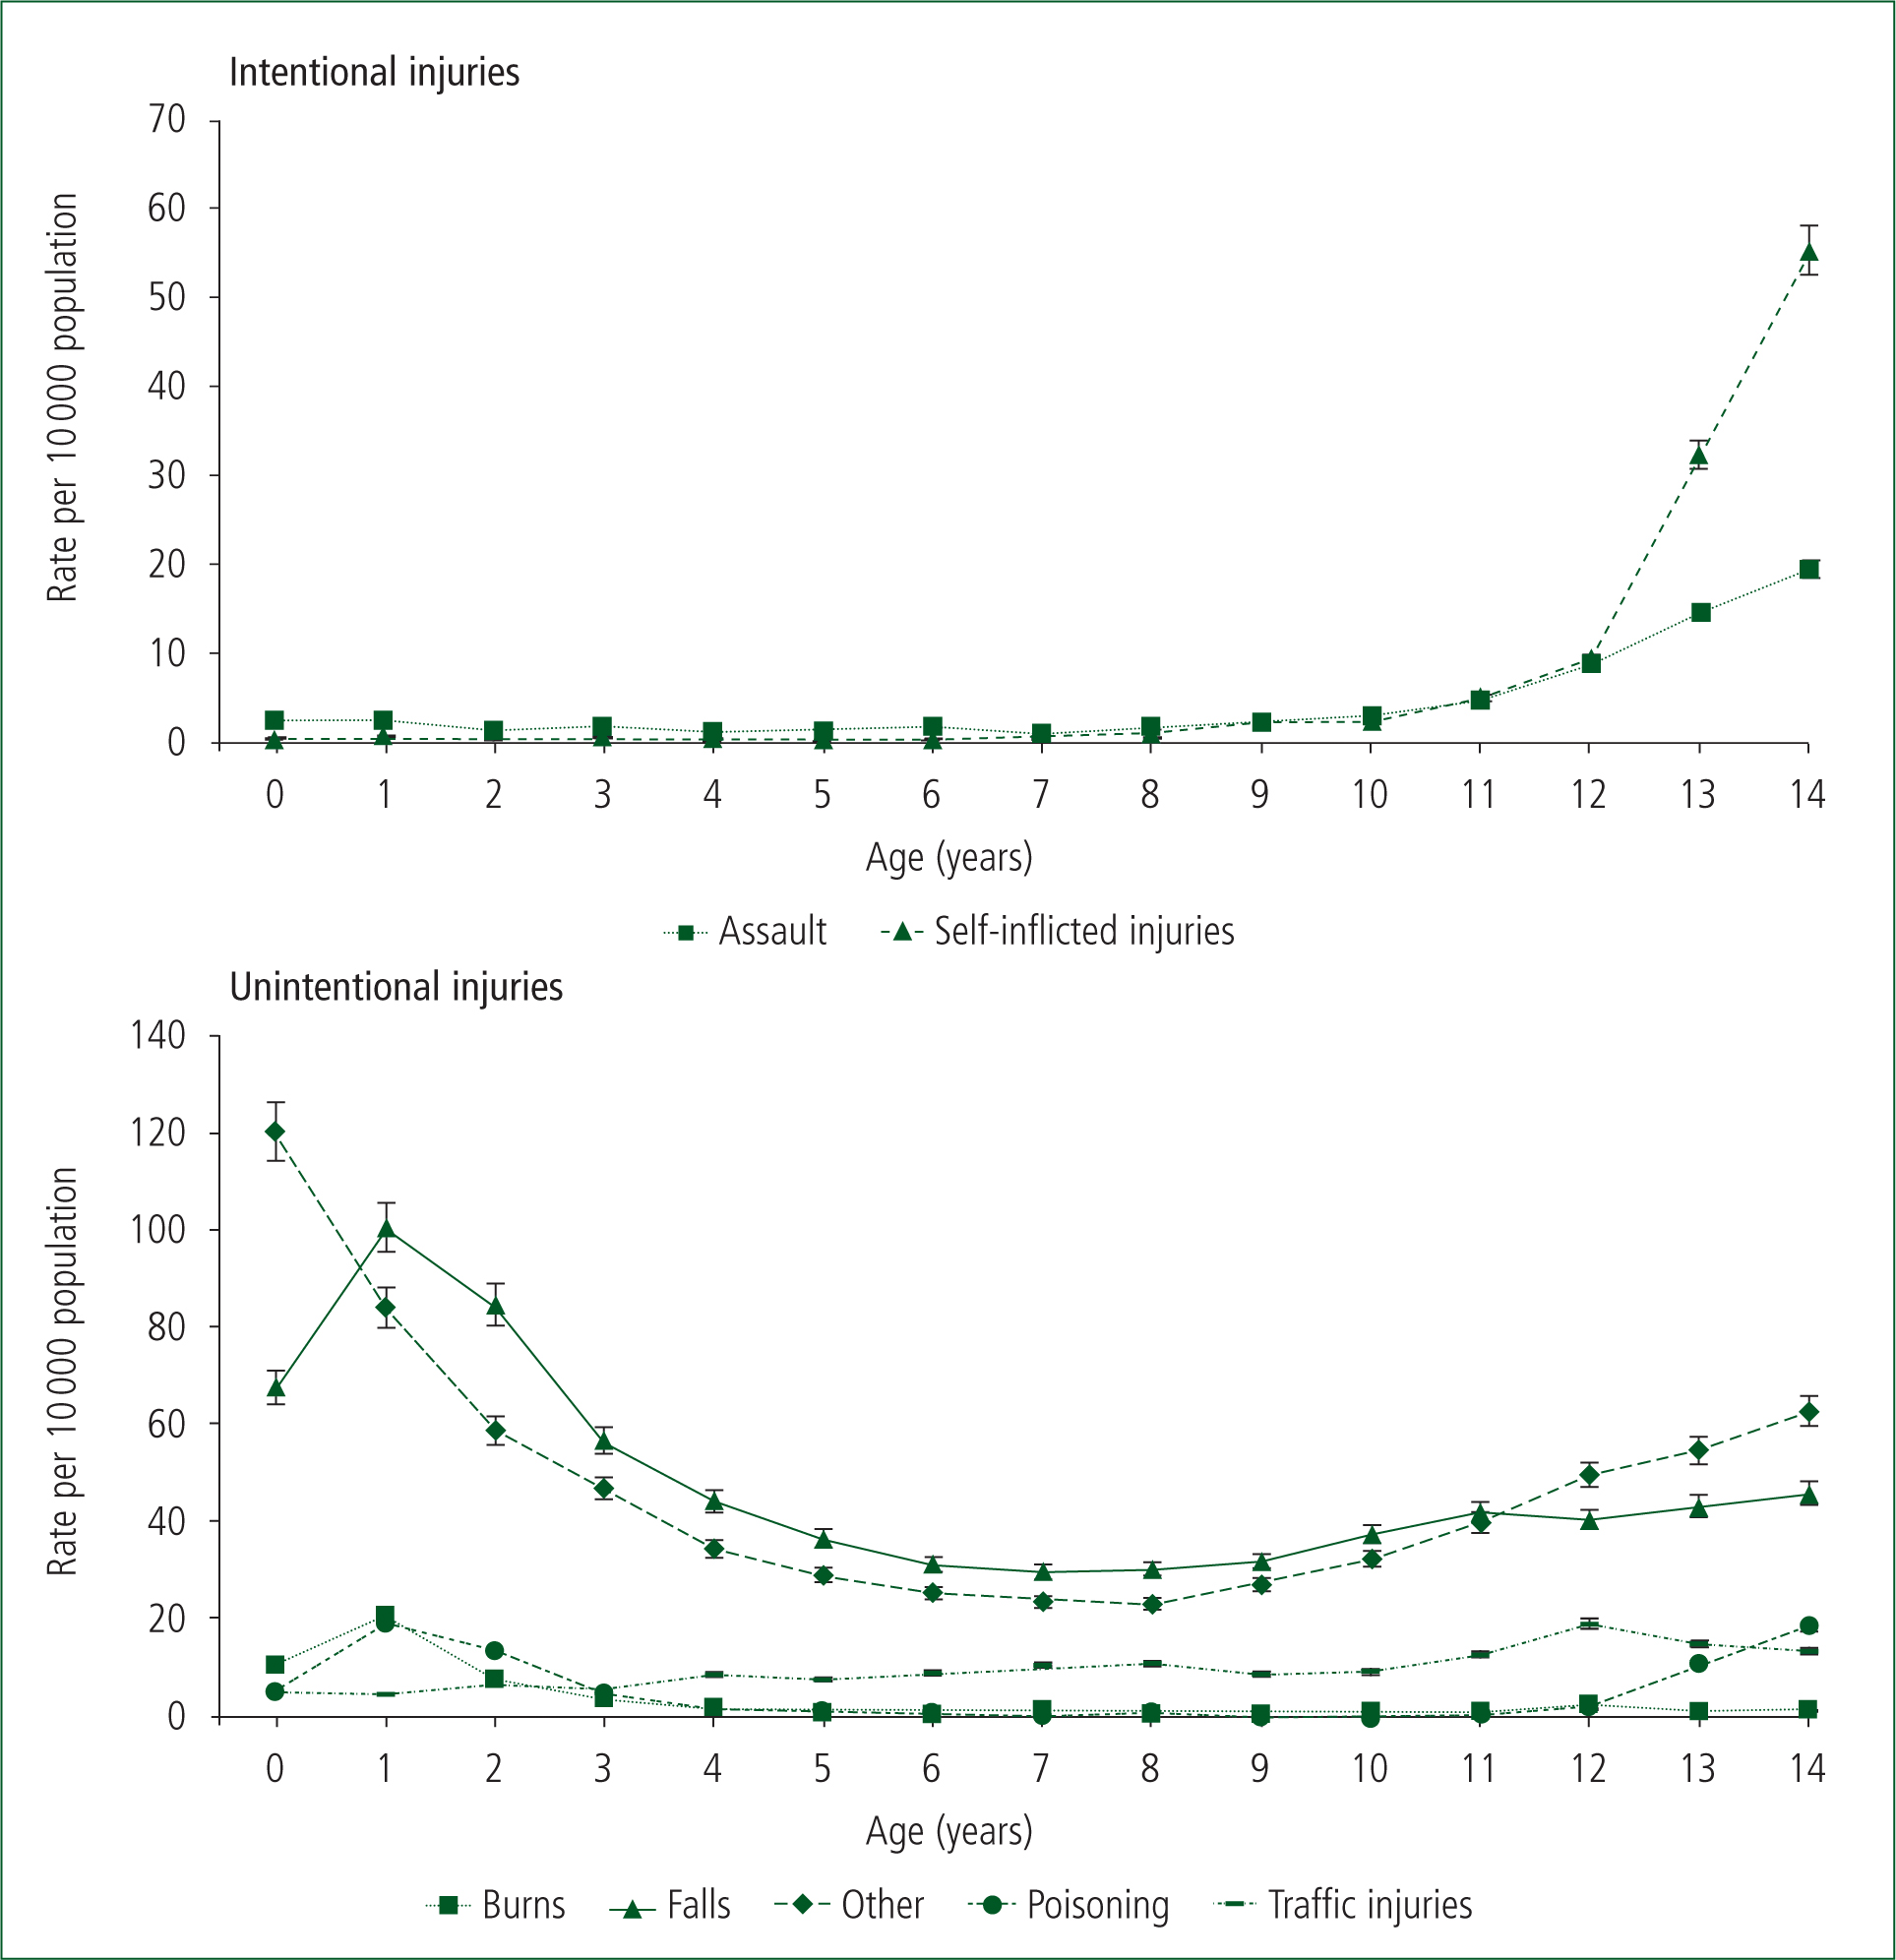
For poisoning, the incidence peaked at age 1 year and again at 14 years, while the incidence of traffic injuries was generally higher for children aged 4 years and over. Table 1 shows the distribution of child injury ambulance call-outs by call-out characteristics. Of all child injury call-outs combined, 45.2% were in those aged 0–4 years, the mean age was 6.5 years (SD=5.0) and 57.1% were boys. In terms of the call-out location, 46.2% were in the most deprived areas (quintile 5) and 92.8% were in urban areas (59.3% in a major conurbation and 33.5% in a city or town). The majority (80.7%) of child injury call-outs resulted in the child being conveyed to another healthcare provider for further treatment.
| All child injuries (n=16 285) | Intentional injuries (n=1405) | Unintentional injuries (n=14 880) | P valuee | |
|---|---|---|---|---|
| Mean age (SD) | 6.5 (5.0) | 12.0 (3.3) | 5.9 (4.8) | |
| Age group (years) | <0.001 | |||
| 0–4 | 7358 (45.2%) | 94 (6.7%) | 7264 (48.8%) | |
| 5–9 | 3205 (19.7%) | 98 (7.0%) | 3107 (20.9%) | |
| 10–14 | 5722 (35.1%) | 1213 (86.3%) | 4509 (30.3%) | |
| Sexa | <0.001 | |||
| Female | 6925 (42.9%) | 760 (55.0%) | 6165 (41.7%) | |
| Male | 9229 (57.1%) | 622 (45.0%) | 8607 (58.3%) | |
| Deprivation quintileb | 0.001 | |||
| 1 least deprived | 1574 (9.7%) | 107 (7.6%) | 1467 (9.9%) | |
| 2 | 1978 (12.1%) | 147 (10.5%) | 1831 (12.3%) | |
| 3 | 1887 (11.6%) | 152 (10.8%) | 1735 (11.7%) | |
| 4 | 3319 (20.4%) | 287 (20.4%) | 3032 (20.4%) | |
| 5 most deprived | 7527 (46.2%) | 712 (50.7%) | 6815 (45.8%) | |
| Location area typec | <0.001 | |||
| Rural | 1180 (7.2%) | 74 (5.3%) | 1106 (7.4%) | |
| Urban: city/town | 5454 (33.5%) | 415 (29.5%) | 5039 (33.9%) | |
| Urban: major conurbation | 9651 (59.3%) | 916 (65.2%) | 8735 (58.7%) | |
| Conveyed to healthcare providerd | <0.001 | |||
| Yes | 13 143 (80.7%) | 1039 (74.0%) | 12 104 (81.3%) | |
| No | 3142 (19.3%) | 366 (26.0%) | 2776 (18.7%) |
Where sex was recorded (n=16 154; 99.2%);
Deprivation quintile of call-out location;
Area type of call-out location; urban: city/town includes cities and towns in a sparse setting;
conveyed to healthcare provider, including emergency department, urgent care centre, minor injuries unit, walk-in centre and general practitioner;
Analysis uses χ2
There were significant differences in call-out characteristics between intentional injuries and unintentional injuries (Table 1). The majority (86.3%) of intentional injury call-outs involved children aged 10–14 years, while 48.8% of unintentional injury call-outs were to children aged 0–4 years.
Compared with unintentional injuries (41.7%), a higher proportion of intentional injury (55.0%) call-outs were to girls; the proportion of children who sustained intentional injuries were less likely to be conveyed to a healthcare provider than those with unintentional injuries (74.0% against 81.3%).
Table 2 shows the distribution of child injury ambulance call-outs by characteristic and injury type. Children aged 0–4 years accounted for 78.0% of burns and 57.3% of poisoning-related call-outs, while 10–14 year-olds accounted for 74.3% of assaults and 93.7% of self-inflicted injury call-outs. Two-thirds (68.3%) of assault call-outs were for males, while more girls than boys had self-inflicted injuries (68.9%) and poisoning (53.1%). In terms of the call-out location, in all injury types, call-outs generally increased with deprivation, with more than half of assaults (59.8%) and burns (54.1%) call-outs to the most deprived areas (quintile 5). The majority of call-outs were to urban areas for all injury types, especially for assaults (97.2%) (Table 2). Although the majority of children were conveyed to another healthcare provider for further treatment for all injury types, there were some variations in proportion by injury type. Call-outs where the child was transported for further treatment were higher for falls (84.8%), burns (84.2%) and poisoning (81.9%).
| Intentional injuries | Unintentional injuries | ||||||
|---|---|---|---|---|---|---|---|
| Assault (n=533) | Self-inflicted injuries (n=872) | Burns (n=519) | Falls (n=6256) | Other unintentional injuries (n=6115) | Poisoning (n=698) | Traffic injuries (n=1292) | |
| Mean age (SD) | 10.6 (4.2) | 12.8 (2.1) | 3.2 (3.9) | 5.7 (4.6) | 5.9 (5.0) | 6.2 (5.7) | 8.2 (4.1) |
| Age group (years) | |||||||
| 0–4 | 75 (14.1%) | 19 (2.2%) | 405 (78.0%) | 3132 (50.1%) | 3038 (49.7%) | 400 (57.3%) | 289 (22.4%) |
| 5–9 | 62 (11.6%) | 36 (4.1%) | 48 (9.3%) | 1434 (22.9%) | 1154 (18.9%) | 39 (5.6%) | 432 (33.4%) |
| 10–14 | 396 (74.3%) | 817 (93.7%) | 66 (12.7%) | 1690 (27.0%) | 1923 (31.4%) | 259 (37.1%) | 571 (44.2%) |
| Sexa | |||||||
| Female | 164 (31.7%) | 596 (68.9%) | 223 (43.2%) | 2634 (42.2%) | 2498 (41.0%) | 368 (53.1%) | 442 (35.9%) |
| Male | 353 (68.3%) | 269 (31.1%) | 293 (56.8%) | 3606 (57.8%) | 3593 (59.0%) | 325 (46.9%) | 790 (64.1%) |
| Deprivation quintileb | |||||||
| 1 least deprived | 22 (4.1%) | 85 (9.7%) | 47 (9.1%) | 627 (10.0%) | 648 (10.6%) | 60 (8.6%) | 85 (6.6%) |
| 2 | 41 (7.7%) | 106 (12.2%) | 41 (7.9%) | 807 (12.9%) | 781 (12.8%) | 64 (9.2%) | 138 (10.7%) |
| 3 | 48 (9.0%) | 104 (11.9%) | 46 (8.9%) | 737 (11.8%) | 707 (11.6%) | 77 (11.0%) | 168 (13.0%) |
| 4 | 103 (19.3%) | 184 (21.1%) | 104 (20.0%) | 1290 (20.6%) | 1224 (20.0%) | 155 (22.2%) | 259 (20.0%) |
| 5 most deprived | 319 (59.8%) | 393 (45.1%) | 281 (54.1%) | 2795 (44.7%) | 2755 (45.1%) | 342 (49.0%) | 642 (49.7%) |
| Location area typec | |||||||
| Rural | 15 (2.8%) | 59 (6.8%) | 42 (8.1%) | 502 (8.0%) | 437 (7.1%) | 36 (5.2%) | 89 (6.9%) |
| Urban: city/town | 161 (30.2%) | 254 (29.1%) | 149 (28.7%) | 2139 (34.2%) | 2123 (34.7%) | 228 (32.7%) | 400 (31.0%) |
| Urban: major conurbation | 357 (67.0%) | 559 (64.1%) | 328 (63.2%) | 3615 (57.8%) | 3555 (58.1%) | 434 (62.2%) | 803 (62.2%) |
| Conveyed to healthcare providerd | |||||||
| Yes | 361 (67.7%) | 678 (77.8%) | 437 (84.2%) | 5306 (84.8%) | 4833 (79.0%) | 572 (81.9%) | 956 (74.0%) |
| No | 172 (32.3%) | 194 (22.2%) | 82 (15.8%) | 950 (15.2%) | 1282 (21.0%) | 126 (18.1%) | 336 (26.0%) |
Where sex was recorded (n=16 154, 99.2%);
Deprivation quintile of call-out location;
Area type of call-out location; urban: city/town includes cities and towns in a sparse setting;
conveyed to healthcare provider, including emergency department, urgent care centre, minor injuries unit, walk-in centre and general practitioner
Table 3 shows the results of GLM on the effects of months, weekends, English bank holidays and celebration days (Halloween and Guy Fawkes night) on child injury ambulance call-outs. Estimated marginal means were highest in June for all injury ambulance call-outs combined, intentional injuries and unintentional injuries. Although results were non-significant, all child injury call-outs and unintentional injury call-outs were elevated on celebration days (Table 3).
| All child injury call-outs | Intentional child injury call-outs | Unintentional child injury call-outs | ||||||||||
|---|---|---|---|---|---|---|---|---|---|---|---|---|
| Mean | 95% CI | P value | Mean | 95% CI | p-value | Mean | 95% CI | P value | ||||
| Month | ||||||||||||
| Jan | 33.16 | 26.07 | 40.25 | 0.063 | 2.40 | 0.76 | 4.04 | 0.283 | 30.76 | 24.00 | 37.51 | 0.027 |
| Feb | 38.70 | 31.39 | 46.00 | 0.469 | 2.72 | 1.03 | 4.42 | 0.093 | 35.97 | 29.01 | 42.93 | 0.724 |
| Mar | 47.53 | 40.29 | 54.78 | <0.001 | 3.42 | 1.74 | 5.09 | 0.002 | 44.12 | 37.22 | 51.02 | <0.001 |
| Apr | 42.18 | 34.92 | 49.44 | 0.019 | 1.67 | -0.01 | 3.36 | 0.697 | 40.50 | 33.58 | 47.42 | 0.011 |
| May | 52.93 | 45.84 | 60.02 | <0.001 | 3.49 | 1.85 | 5.14 | 0.001 | 49.44 | 42.68 | 56.19 | <0.001 |
| Jun | 53.45 | 46.19 | 60.71 | <0.001 | 3.83 | 2.15 | 5.52 | <0.001 | 49.62 | 42.70 | 56.54 | <0.001 |
| Jul | 50.94 | 43.70 | 58.18 | <0.001 | 3.01 | 1.33 | 4.69 | 0.022 | 47.93 | 41.03 | 54.82 | <0.001 |
| Aug | 52.48 | 45.31 | 59.64 | <0.001 | 2.95 | 1.29 | 4.61 | 0.028 | 49.53 | 42.70 | 56.35 | <0.001 |
| Sep | 51.68 | 44.42 | 58.95 | <0.001 | 3.50 | 1.82 | 5.18 | 0.001 | 48.18 | 41.26 | 55.10 | <0.001 |
| Oct | 46.32 | 39.39 | 53.26 | <0.001 | 2.67 | 1.06 | 4.27 | 0.109 | 43.65 | 37.05 | 50.26 | <0.001 |
| Nov | 40.31 | 33.37 | 47.26 | 0.139 | 2.15 | 0.54 | 3.76 | 0.578 | 38.17 | 31.55 | 44.79 | 0.156 |
| Dec | 37.10 | 30.08 | 44.12 | Ref | 1.87 | 0.24 | 3.49 | Ref | 35.23 | 28.54 | 41.92 | Ref |
| Weekend | ||||||||||||
| Yes | 45.69 | 39.03 | 52.35 | 0.795 | 2.71 | 1.17 | 4.26 | 0.398 | 42.98 | 36.63 | 49.33 | 0.633 |
| No | 45.44 | 38.85 | 52.03 | Ref | 2.90 | 1.38 | 4.43 | Ref | 42.54 | 36.26 | 48.82 | Ref |
| Bank holiday | ||||||||||||
| Yes | 43.92 | 35.59 | 52.25 | 0.284 | 2.50 | 0.57 | 4.43 | 0.389 | 41.42 | 33.48 | 49.35 | 0.360 |
| No | 47.21 | 41.32 | 53.10 | Ref | 3.11 | 1.75 | 4.48 | Ref | 44.10 | 38.48 | 49.71 | Ref |
| Celebration day | ||||||||||||
| Yes | 48.10 | 36.01 | 60.19 | 0.399 | 2.09 | –0.71 | 4.89 | 0.304 | 46.01 | 34.49 | 57.53 | 0.256 |
| No | 43.03 | 39.99 | 46.06 | Ref | 3.52 | 2.82 | 4.23 | Ref | 39.51 | 36.61 | 42.40 | Ref |
Reference categories for comparison: December, midweek, non-bank holidays, non-celebration days; celebration days: Halloween, Guy Fawkes night
GLM analyses on the specific injury types revealed that weekends and celebration days showed an independent increase in burns-related ambulance call-outs to 5–9 year-olds Therefore, burn injury call-outs increased significantly by 23% (P=0.003) at weekends and by 573% (P=0.001) on celebration days in 5–9 year-olds. Weekends were associated with a 94% (P=0.001) significant increase in poisoning-related ambulance call-outs to 10–14 year-olds. At weekends, there were significantly fewer call-outs for traffic injury to 0-4 year-olds and 10–14 year-olds, with a 54% (P=0.009) and 29% (P=0.003) increase in call-outs midweek respectively.
Discussion
Our findings show the burden of child injury on an ambulance trust in the north west of England. Injuries are preventable (Krug et al, 2000; Peden et al, 2008; Sethi et al, 2008; WHO, 2014) and, with urgent and emergency ambulance services provided by NHS ambulance trusts in England costing £1.78 billion in one year alone (National Audit Office, 2017), action to tackle the burden is needed.
This study found that injuries are predictable if it is known who is most at risk, and when and where they are most likely to occur, through comprehensive surveillance systems (Holder et al, 2001; Peden et al, 2008). Insufficient data result in the burden of injury being underestimated, particularly if key injury types are missing from data sources, so the availability of good quality data is key to establishing the extent and nature of injury for the purpose of targeted prevention activity (Peden et al, 2008; Sethi et al, 2008).
The ambulance dataset used in this study meant that call-outs could be categorised into the injury types used by WHO, while research into ED data highlighted a lack of coding for some injury groups.
A study of 0–14 year-olds attending EDs across England because of injury, using a national monitoring system, was limited as there were deficiencies in injury grouping options (Hughes et al, 2014). The study found 88.7% of incidents were categorised as ‘other’ injury, with falls and other key injury types missing.
In comparison, the present study's recording into WHO injury types using ICD-10 categorisation found that 37.5% of child injury ambulance call-outs were ‘other’ injuries, with the remaining call-outs categorised as a specific injury type, and falls accounting for the largest proportion (38.4%). In England, falls are the main cause of injury-related hospital admissions in children aged 0–4 years, so prevention of falls in the under-5s is a national priority (PHE, 2017). Of the fall-related ambulance call-outs, found 50.1% involved children aged 0-4 years, and falls in 0-4 year-olds accounted for 19.2% of all child injury ambulance call-outs.
Furthermore, a case study in the development of a comprehensive ED injury surveillance system found more than three out of five ‘other injuries’ were falls (Quigg et al, 2012). As falls and other key injury types are missing from ED attendance data, the findings of this study highlight a strength in the use of ambulance data to comprehensively understand the epidemiology and characteristics of child injuries.
WHO promotes the sharing and use of data as a public health approach to injury prevention (Holder et al, 2001; Peden et al, 2008; Sethi et al, 2008; WHO, 2014). Injury surveillance systems capture key data, which can be used to inform new and existing policies for prevention, targeting interventions to specific injury groups and populations. Regional and national injury surveillance systems in high- and middle-income countries are well established; however, systems often use data captured in hospitals only (Nelson et al, 2011; Crain et al, 2016; Lyons et al, 2016). To the authors' knowledge, the present study is the only published research in scientific journals that uses ambulance records to study child injuries.
As previous research has found, ambulance data can be used to identify at-risk groups and establish where and when targeted prevention can be applied (Backe and Andersson, 2008; Thomas et al, 2011; Quigg et al, 2017). For example, the authors identified a large proportion of burns call-outs to 0–4 year-olds, and assaults and self-inflicted injury call-outs to 10–14 year-olds. Furthermore, GLM revealed that burns call-outs significantly increased by 23% at weekends and 573% on celebration days in 5–9 year-olds; poisoning significantly increased by 94% at weekends in 10–14 year-olds; and traffic injury call-outs significantly increased by 54% in 0–4 year-olds and 29% in 10–14 year-olds midweek compared to weekends.
Ambulance call-out data can increase knowledge of the burden of injuries, and overlaying it with ED and hospital admissions data could provide a comprehensive description of the epidemiology of child injuries, where other data sources (i.e. ED attendances and hospital admissions) have limitations. Furthermore, there is a well known, strong association between deprivation and injury (Bellis et al, 2011; WHO, 2014). The authors found child injury ambulance call-outs increased with deprivation, with 46.2% of all child injury call-outs to the most deprived areas, and numerous studies have concluded serious inequalities in child injuries (Bartlett, 2002; Hippisley-Cox et al, 2002; Haynes et al, 2003; Edwards et al, 2006; 2008; Siegler et al, 2010; Hughes et al, 2014). Several factors have been associated with an increased injury of risk in children living in deprived areas, including housing conditions, heavy traffic, a lack of safe play space, single parenthood, a lack of parental education and unemployment (Bartlett, 2002). Our research adds to the body of knowledge surrounding inequalities in child injuries and at-risk groups, highlighting the importance of targeted interventions.
The authors found four in five call-outs resulted in the child being transported to another healthcare provider for further treatment. Although the data do not indicate the severity of the injury sustained, it is likely that the majority of call-outs result in the child being conveyed because paediatric policies stipulated this. Most ambulance service protocols state that all children under the age of 2 years must be conveyed to a hospital or other healthcare provider and, ideally, those aged 2–18 years should be conveyed (London Ambulance Service NHS Trust 2016; Yorkshire Ambulance Service NHS Trust, 2016). Further research on the severity of injuries sustained is recommended.
Limitations
The authors examined children aged 0–14 years to correlate results with a PHE indicator and other child injury studies, which used mortality and ED attendance data sources. Childhood has a variety of definitions (Peden et al, 2008) and it appears that older children and young people are under-represented in the literature; therefore, the authors recommend further research to explore injuries in older children and young people.
This study used CAD data only, which rely heavily on the accurate recording of patient information by emergency medical dispatchers. Of all ambulance call-outs made by NWAS between 1 April 2016 and 31 March 2017, 3.9% of records did not have a valid age recorded. This is a free-text field and there are no validations, so patient age is subject to data entry errors or missing data. However, in comparison, a study of ambulance records in Sweden by Backe and Andersson (2008) reported that age was missing for 19.5% of records, considerably more than in the present study.
The NWAS dataset does not follow the International Classification of Diseases and Related Health Problems. The authors aimed to overcome this by examining three data fields to identify injuries, and then categorise them into final injury groups used by WHO. They were somewhat limited by the free-text nature of one of the MPDS fields, so it is possible that a number of injury call-outs were missing from the analysis. Not all instances of poisoning indicated whether it was accidental or intentional and, where this was not specified, call-outs were categorised as poisoning (accidental). The findings show the incidence of poisoning peaked in children aged 1 year and 14 years, suggesting that incidents in 1-year-olds were unintentional ingestion of household substances (Groom et al, 2006; Schmertmann et al, 2013), while in 14-year-olds, incidents were likely unidentified cases of intentional poisoning or self-harm (Hughes et al, 2014). For this reason, it is possible that some poisoning (accidental) incidents could have been self-inflicted injuries.
Conversely, there were a small number of self-inflicted injuries recorded for 0–4 year-olds (n=19), which could be attributed to inaccurate recording of the MPDS description or patient's age. It should be noted that there is a dependence on the caller to supply emergency medical dispatchers with information. As they are not medically trained, this is subjective; therefore, it is possible that information recorded in the MPDS description and problem fields do not match the patient's clinical record.
There are 10 ambulance trusts in England, each with its own data collection system; therefore, the present study of one of these trusts may not be representative of the whole country. However, this study provided analysis of a 1-year sample of >16 000 child injury ambulance call-outs to 0–14 year-olds in the north west of England, and the authors found strengths in its potential as a data source for understanding the epidemiology of child injuries and the burden on ambulance services.
Conclusion
The current findings strengthen previous research of child injury, highlighting changes in the risk of injury throughout childhood, the impact of temporal factors and the strong association between deprivation and injury.
Ambulance call-out data have the potential to provide a more accurate description of child injury, if used alongside other health data sources to provide comprehensive child injury surveillance, and can be used to guide child injury prevention activity and ambulance service delivery. A joined-up, comprehensive surveillance system using different data sources enables a more accurate description of the characteristics of child injury, where limitations with other data sources exist.