
The National Early Warning Score (NEWS) is a simple, rapid assessment tool developed by the Royal College of Physicians (RCP) (2012) to standardise the assessment and monitoring of patients presenting with acute illness. NEWS scores six physiological observations from 0–3 and adds a weighting of two points for the use of supplemental oxygen. The scores are combined to give an indication of the patient's wellbeing (see Appendix 1 for the NEWS tool). NEWS is not suitable for maternity cases or paediatric patients due to their altered physiological norms.
This study will investigate the introduction of NEWS into pre-hospital practice by North East Ambulance Service NHS Foundation Trust (NEAS). NEAS introduced NEWS to support paramedic decision making and to ease communication with other health professionals. NEAS introduced NEWS through the Essential Annual Training (EAT) programme (April 2013 to March 2014). EAT is an annual two-day update for all NEAS staff and NEWS was one element that was covered in around one hour of teaching and discussion. There is a lack of literature describing the use of NEWS in the pre-hospital setting so this study will seek to address this gap and give an insight into how this patient assessment system has been adopted and used by staff.
At present, no clinical actions are linked to NEWS scoring in NEAS. NEWS ≥7 has been proposed as a trigger for pre-alerting the receiving hospital although this has not been implemented yet. Pre-alerting is when paramedics call ahead to notify the receiving department of the impending arrival of a seriously ill patient. Using NEWS to inform referral decisions and trigger screening for sepsis have also been discussed but have yet to be put into practice.
Aims of the research
The aim of this study is to explore the introduction of NEWS into NEAS.
In order to achieve this aim there are seven objectives of this study:
Background
The first early warning score (EWS) system was published by Morgan et al (1997) and was designed to escalate the care of deteriorating patients in hospital. NEWS was developed by the RCP to standardise the systems used and the language spoken across various NHS settings, allowing clearer tracking of the patient's condition and to address the proliferation of EWS. Various adaptions to the scoring system have since been developed including: Physiological Medical Early Warning Scores (PMEWS) (Challen and Walter, 2010); Pandemic Medical Early Warning Scores (PMEWS(b)) (Gray et al, 2010); VitalPAC Early Warning Scores (ViEWS) (Prytherch et al, 2010); and Medical Early Warning Scores (MEWS) (Fullerton et al, 2012).
There have been various calls for the development of a specific pre-hospital EWS. Earley (2010) described the use of trauma scoring systems by ambulance services but the lack of a medical scoring system. He described the early stages of the Prehospital Early Warning Triage Tool (PHEWT) and its need for further development and validation. Roland and Jahn (2012) explored the use of EWS in contemporary paramedic practice and highlighted the difficulties in one system covering all the cases encountered by paramedics and called for more research.
The use of any form of EWS in the pre-hospital setting would require a large pre-hospital study in order to validate the tool and its effectiveness (Groarke et al, 2008; Earley, 2010). Most of the studies done until now have been hospital based and studied the variety of EWS on an inpatient population, although there have been some pre-hospital studies.
Challen and Walter (2010) used a retrospective cohort sample of ambulance records to assess PMEWS in a sample of 214 respiratory patients. They found a high level of over triage, and therefore safety built into the system, and that a significant number of patients could have been referred to alternative pathways using PMEWS. Gray et al (2010) looked at the use of PMEWS(b) in specialist practitioners using a retrospective method. This study focused on respiratory cases and used transport to hospital against referral as the outcome measure and found that PMEWS(b) correlated well with the clinicians decisions. Fullerton et al (2012) used a retrospective cohort study to compare clinician judgement against MEWS using pre-alerts as a measure of clinician detection of critical illness and used in-hospital adverse events as the outcome criteria. They concluded that MEWS was more sensitive than clinician judgement. Studies by Brown and Bleetman (2006) and Booth and Bloch (2013) described the issues with ambulance services pre-alerting receiving hospitals about patients and described how a suitable EWS could clarify this process and provide clearer guidance around this practice.
A recent paper from the Association of Ambulance Chief Executives (AACE) and the National Ambulance Service Medical Directors (NASMeD) set out the clinical priorities for UK ambulance services going forward and included a call to ‘Consider the use of a standard pre hospital warning score—such as the National Early Warning Score for use in both adults and children’ (NASMeD, 2014: 1.13). The widespread adoption of this single system would bring ambulance services in line with other NHS organisations who have adopted, or plan to adopt, NEWS (Sprinks, 2013).
Methods
A retrospective cross-sectional method was used in order to address the aims of this study. Mann (2003) describes how a cross-sectional study is appropriate for examining prevalence and is therefore suitable for this study. An initial sample was collected from a single 24-hour period, selected using a random number generator, from the most recent month known to have a complete data set at the start of the study. The date selected for the initial sample (T1) was Monday 8 July 2013.
Due to time constraints a single, smaller, second sample (T2) was taken from Tuesday 1 April 2014. This date was purposefully selected to address a limitation in the initial sample. This was a 10% sample selected using every 10th case (sorted by case number) over the 24-hour period.
Manual and electronic methods of data collection were explored in order to address objective 1. An electronic method of data collection was created by the NEAS Informatics department in order to automate the process. Concurrent manual data collection was conducted which involved accessing the records (electronic and paper based) for each individual patient and transcribing the data into an Excel spreadsheet. This manual data collection was carried out by the author and took approximately one 37.5 hour week worth of time. The time taken to collect this data is based on largely electronic data (T1=85%, T2=100%) which the author had access to.
The variables sought from the electronic solution started with seven NEWS variables and evolved as the data collection tool developed. Data was recorded on the variables in Table 1 during data collection. A retrospective NEWS was calculated and a low/medium/high NEWS category was assigned for all cases based on the documented sets of observations.
| Operational | Demographic | NEWS | Outcome |
|---|---|---|---|
| Date | Gender (M/F) | Respiratory rate (per min) | Transported (Y/N) |
| Job number | Age (Years) | Oxygen saturations (%) | Pre-alert (Y/N) |
| Observation set | Supplemental oxygen (Y/N) | Trauma bypass (Y/N) | |
| Source (paper/electronic) | Temperature (°C) | COPD (Y/N) | |
| Station | Systolic blood pressure (mmHg) | Sepsis (Y/N) | |
| Chief complaint | Heart rate (BPM) | Maternity (Y/N) | |
| Call type (emergency/urgent) | AVPU | Hospital transfer (Y/N) | |
| Time on scene (mins) | NEWS applied (Y/N) | ||
| Crew NEWS (0–20) |
NHS permission was secured from NEAS R&D department (personal communication, 25 October 2013). No ethical approval was necessary for this audit-based study based on the online tool and guidance available on the Health Research Authority (HRA) website (HRA, 2013a; HRA, 2013b).
Analysis
Due to the inclusion of mixed independent and dependent data and the large amounts of missing data, the findings are reported using primarily descriptive statistics which were calculated within an Excel spreadsheet.
Results
Objective 1. Develop a method of collecting data on suitable cases
An electronic data collection solution was developed but due to limitations described in the discussion section was of limited use in addressing the objectives of this study. Manual data collection is feasible, if time consuming. All following results are from the manual data.
Objective 2. Establish the number of calls that are suitable for NEWS
In the initial sample (T1) of 894 patients and 1 575 sets of observations, all patients that were unsuitable for NEWS were removed (paediatrics, maternity, cardiac arrests), which left 90% (n=806) of patients. Of the patients included, 53% (n=424) were male with a mean age of 60 years (range: 16–100). These calls resulted in 1 456 sets of observations (mean observations per patient 1.7, range: 1–7). In total, 81% (n=654) of the calls were classed by the contact centre as emergencies requiring a blue light response, with the remainder being classed as urgent requiring a non-blue light response.
In the secondary 10% sample (T2) of 91 patients and 150 sets of observations, again all patients that were unsuitable for NEWS were removed, which left 91% (n=83) of patients. Of the patients included, 54% (n=44) were male with a mean age of 61 years (range: 17–94). These calls resulted in 139 sets of observations (mean observations per patient 1.6, range: 1–5). In total, 84% (n=70) of the calls were classed as emergencies.
The high percentage of cases that have been included may not be representative of where NEWS would be used, or has value, in practice. The use of simple exclusion criteria (paediatrics, maternity, cardiac arrests) leads to the large sample population.
Objective 3. Establish the prevalence of NEWS usage
NEWS was rarely recorded by paramedics in either sample. NEWS was recorded for 0.7% (n=6) of patients at T1 and zero patients at T2. This result is surprisingly low as higher use of NEWS was anticipated. Exploring the reasons behind this low use could be the subject of further work.
Objective 4. Establish the completeness of the data set in terms of NEWS variables
The elements that comprise NEWS were recorded with varying levels of frequency in the NEWS eligible cases (see Figure 1). The values for the recorded observations are shown in Table 2.

| T1 | T2 | |||||
|---|---|---|---|---|---|---|
| Mean | SD | Range | Mean | SD | Range | |
| Respiratory rate | 19 | 5 | 1–60 | 18 | 4 | 12–38 |
| Oxygen saturations | 96 | 4 | 52–100 | 96 | 4 | 75–100 |
| Supplemental oxygen | 238 (16%) recorded oxygen use | 8 (6%) recorded oxygen use | ||||
| Temperature | 36.9 | 0.9 | 34.0-–40.1 | 36.6 | 1.0 | 34.4–39.6 |
| Systolic blood pressure | 137 | 26 | 62–237 | 131 | 27 | 64–238 |
| Heart rate | 88 | 23 | 14–211 | 89 | 22 | 45–147 |
| Level of consciousness | A=93% V=3% P=2% U=2% | A=98% V=2% P=0% U=0% | ||||
Level of consciousness recorded as a GCS score (1–15) was converted to AVPU using GCS 15=A, GCS 14=V, GCS 13–9=P, GCS>9=U as described by Prytherch et al (2010) and Smith et al (2013).
The number of the seven NEWS elements recorded varied across sets of observations as displayed in Figure 2.
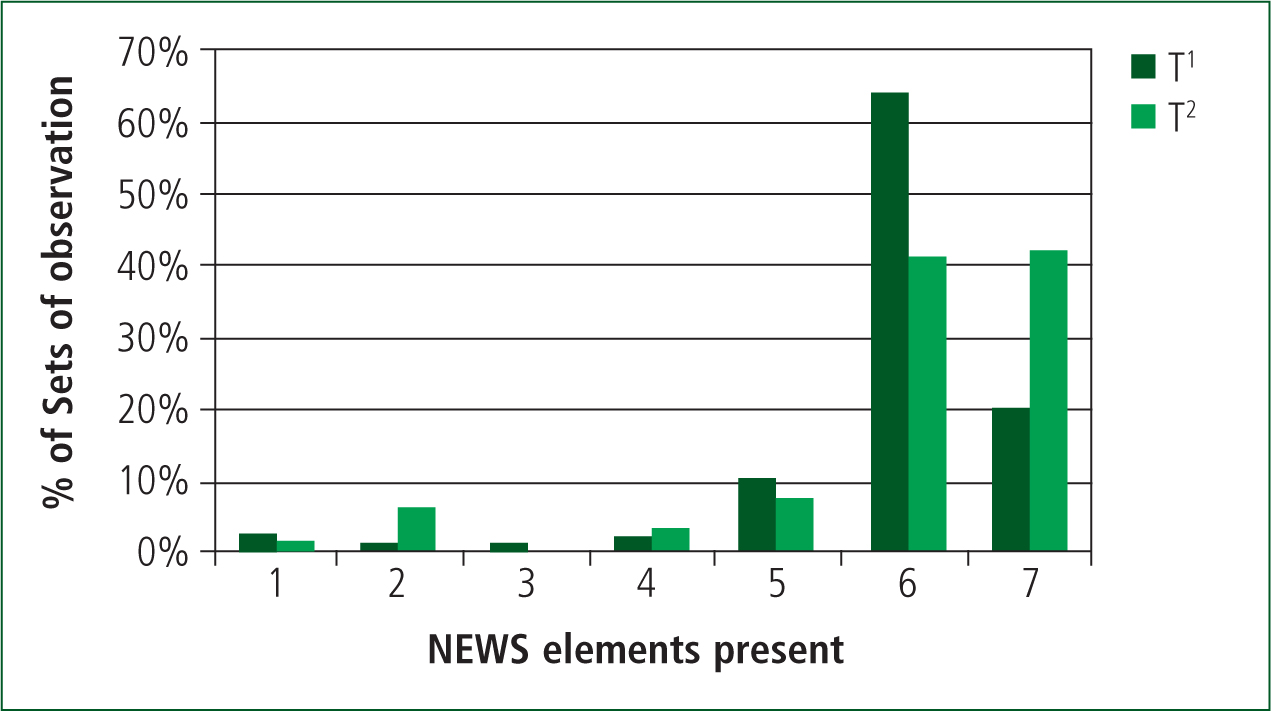
Some records included no observations at all but the recording of the presence or absence of supplemental oxygen means that at least one observation is recorded for all cases.
Objective 5. Describe the sample population according to NEWS
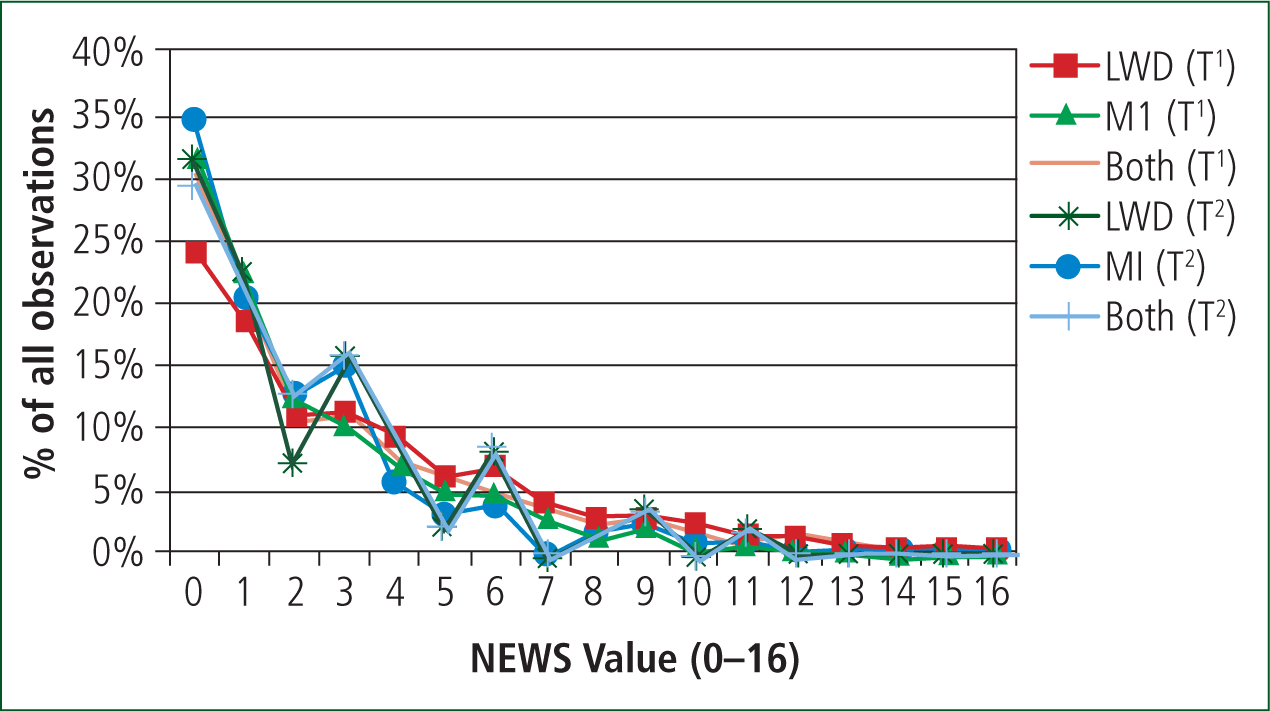
The NEWS of the sample population is described using three differing methods of dealing with the missing data. The first method uses listwise deletion (LWD), where any set of observations that does not comprise all seven elements of NEWS is deleted.
The second method uses mean imputation (MI) to impute the missing data by replacing any missing values with the mean of the existing values for that observation.
The third method combines the first two methods and uses MI for observation sets with 1 or 2 missing values and LWD for observation sets with >2 missing values. This technique was used by Challen and Walter (2010) and Gray et al (2010) for similar data sets.
There is broad agreement across all three methods of addressing the missing data in the variables described. The description of the population could be expanded in further work by sub-group analysis of variables such as presenting complaint, gender and time on scene.
The patient population can also be described in terms of transport rates. The samples show comparable transport rates of 86% (T1) and 79% (T2), which can be broken down using NEWS categories (using MI and LWD) as shown in Figure 4.
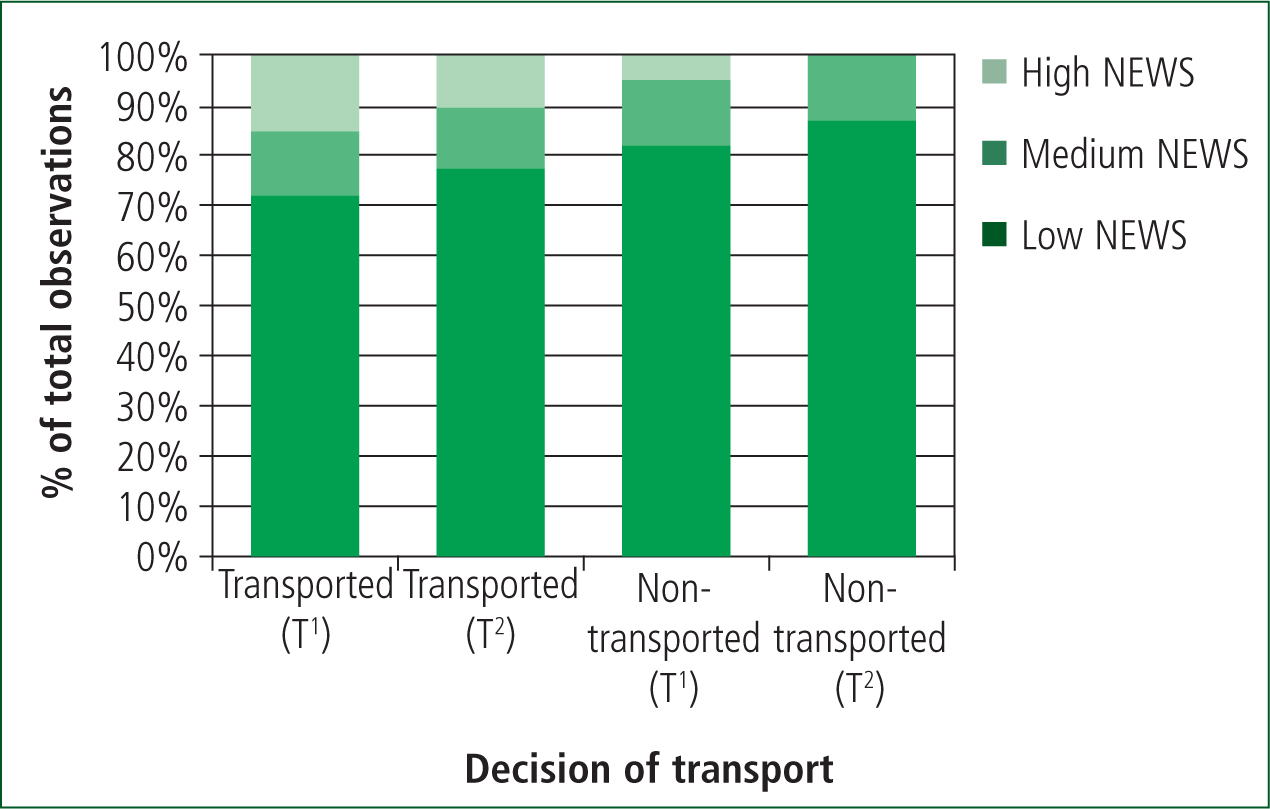
From Figure 4 it appears that those with a higher NEWS are more likely to be transported but there was no statistically significant difference in any NEWS category when compared using Fisher's exact test (p=0.05). There are small numbers in the non-transport group (particularly at T2) so larger samples may reveal a different picture.
Objective 6. Explore any changes to practice that may result from linking pre-alerts to NEWS ≥ 7
This study shows pre-alert rates comparable to previous work (McClelland and Younger, 2013). Table 6 shows details of the pre-alerts based on the sample data and those based on NEWS ≥7. There is very little agreement between the current practice of paramedic decision to pre-alert and the pre-alerts generated by NEWS ≥7.
| LWD | Patients | Observations | Age | Gender (Male) | NEWS | |||||||
|---|---|---|---|---|---|---|---|---|---|---|---|---|
| Mean | SD | Range | Mean | SD | Range | Low | Medium | High | ||||
| T1 | 238 | 287 | 62 | 21 | 16–98 | 50% | 3.0 | 3.0 | 0–13 | 65.5% | 21.3% | 13.2% |
| T2 | 51 | 58 | 59 | 24 | 17–94 | 49% | 2.3 | 2.6 | 0–11 | 75.9% | 17.2% | 6.9% |
| MI | Patients | Observations | Age | Gender (Male) | NEWS | |||||||
|---|---|---|---|---|---|---|---|---|---|---|---|---|
| Mean | SD | Range | Mean | SD | Range | Low | Medium | High | ||||
| T1 | 806 | 1456 | 60 | 22 | 16–100 | 53% | 2.4 | 2.7 | 0–16 | 73.4% | 17.4% | 9.2% |
| T2 | 83 | 139 | 61 | 23 | 17–94 | 53% | 2.0 | 2.3 | 0–11 | 82.0% | 12.9% | 5.0% |
| MI and LWD | Patients | Observations | Age | Gender (Male) | NEWS | |||||||
|---|---|---|---|---|---|---|---|---|---|---|---|---|
| Mean | SD | Range | Mean | SD | Range | Low | Medium | High | ||||
| T1 | 754 | 1368 | 60 | 22 | 16–100 | 53% | 2.5 | 2.7 | 0–16 | 71.9% | 18.3% | 9.7% |
| T2 | 77 | 125 | 61 | 23 | 17–94 | 52% | 2.1 | 2.4 | 0–11 | 79.2% | 15.2% | 5.6% |
| Pre-alerts from sample data | Pre-alerts based on NEWS≥7 (LWD and MI) | ||
|---|---|---|---|
| T1 | Patients | 4.3% (n=30) | 9.1%(n=63) |
| Age | 59 (16–88) | 67 (24–95) | |
| Gender | 67% male | 54% female | |
| NEWS (low/medium/high) | 43%/20%/37% | 0/0/100% | |
| Chief complaints | Chest pain (23%), breathing (20%), stroke (16%) | Breathing (52%), non-specifically unwell (19%) | |
| Transported | 100% | 97% | |
| Pre-alerted | 100% | 16% | |
| T2 | Patients | 4.9% (n=3) | 6.6% (n=4) |
| Age | 53 (22–82) | 65 (51–74) | |
| Gender | 100% male | 100% female | |
| NEWS (low/medium/high) | 100%/0/0 | 0/0/100% | |
| Chief complaints | Assault (33%), chest pain (33%), stroke (33%) | Breathing (50%), chest pain (25%), bleed (25%) | |
| Transported | 100% | 100% | |
| Pre-alerted | 100% | 0 |
Objective 7. Generate data in order to inform the development of a larger study
This pilot study has been designed to collect data to inform the development of a more comprehensive study into NEWS. A larger study would need to give careful thought to data collection methods, improving the data set by reinforcing the need for full sets of observations, examining why the use or recording of NEWS is so low, linking patient outcomes to NEWS and linking actions carried out by the paramedics to NEWS.
Discussion
This study set out to explore the introduction of NEWS into NEAS and assess potential changes to practice that may result from its use. This is the first study, to the author's knowledge, of the application of NEWS into a pre-hospital setting so is valuable, despite its limitations, due to the lack of existing work in this area and the increasing use of NEWS.
The study has shown that NEWS was not being widely documented and therefore presumably not used in practice by NEAS staff at the point where the samples were taken. Half of the recorded uses of NEWS were attributed to one ambulance crew. The study does show that the majority of the observations necessary for NEWS are being recorded for the majority of patients (Figure 1 and 2) and that the mean set of observations (Table 2) will generate a NEWS of 0. No NEWS values >16, which would have indicated a patient with severely altered physiology, were recorded. Temperature stands out as an observation that is not regularly, or repeatedly, recorded. This may be due to new thermometers being introduced during the study. The fact that temperature is often only recorded once per patient whereas other observations are repeated emerges from the data, which also explains the lower frequency of use. The improvement in temperature recording may be linked to the improvement seen in the number of patients with all seven NEWS elements recorded.
Three methods of dealing with missing data were applied in this study and all produced similar results. This inspires some degree of confidence in the overall spread of NEWS across the pre-hospital population but these are all simple statistical methods with acknowledged issues (Hawthorne and Elliott, 2005). The combination of LWD and MI provides a simple and pragmatic method of retaining a large dataset, while addressing the missing data issue.
The findings of this study with regards to linking pre-alerts to NEWS ≥7, which may have been conceived to address the issues raised by Brown and Bleetman (2006) and Booth and Bloch (2013), indicate that further thought needs to be given to any interventions, or actions, that are going to be linked to NEWS. There is very little agreement on any measure, apart from transportation, between the sample data and the pre-alerts indicated by NEWS. It needs to be borne in mind that pre-alerts are mandated for a number of conditions such as STEMI, stroke or major trauma, which may, or may not, trigger on NEWS. Paramedics are used to deciding to pre-alert based on clinical impression as opposed to scoring mechanisms, so this is an area which requires further work.
Limitations
A major limitation that emerged with the initial sample was that it was taken while the training on NEWS was still being delivered. Only 38% of front-line staff were trained on NEWS at that date (personal communication, 25 October 2013). Due to this we do not know whether the crews from the three different shifts on the sample date were trained in the use of NEWS at that point in time. The second sample was a purposive sample and was taken after the 2013/14 EAT was delivered, so all staff should be trained on NEWS to address this limitation, although this does not take into account any time needed for practice to change and new systems to become embedded.
The use of a single ambulance service limits the generalisability of the findings in terms of NEWS usage by staff, but the method used and the description of the population according to NEWS criteria should be applicable in other areas. Comparing this data with similar samples from other ambulance services using NEWS would allow more robust conclusions to be drawn. The inclusion of more samples would allow any factors relating to specific days of the week or seasons to be explored, which is impossible with only two samples.
The lack of a reliable method of automating the data collection process hampers the repeatability of the study due to the time consuming nature of manual data collection and limits the ability to repeat the study and examine longitudinal patterns in NEWS usage. Limitations inherent in the electronic data collection that need to be addressed include the variety in the recording of basic elements such as oxygen use, linking of multiple records if multiple crews attend the same incident, and recognition of multiple sets of observations from a single patient.
The purely quantitative nature of this study limits the explanations that can be given for the findings presented. Further work should use a mixed methods approach or focus on the qualitative element in order to establish if the results presented are repeatable and also to explore paramedics' thoughts, which may shed some light on the reasons behind the results.
Further research
A number of areas have emerged with potential for further study, these include:
Conclusions
This study has shown that NEWS was not being documented, and therefore presumably not being used in practice despite the majority of the necessary elements being recorded. NEWS does not appear to have been adopted into NEAS practice since its introduction in 2013/14. NEWS, or any form of early warning score, will not function to support decision making, enhance communications and safeguard patients unless paramedics adopt the system, the necessary basic observations are taken, and the scoring system is linked to appropriate actions.