
This series on NHS capacity planning has highlighted the role of the nearness to death effect upon hospital inpatient demand (Jones, 2019a; 2019b) and this will serve as the third article in this short series. The absolute number of deaths serves as a retrospective measure of the end-of-life pressure faced by each locality, where around half of a person's lifetime inpatient demand is compressed into the last year of life.
End-of-life demand is highly volatile
NHS demand is therefore highly sensitive to the volatility in deaths. The sad fact is that deaths are highly volatile and that the magnitude of this volatility is location-specific (Jones, 2012). This implies that the marginal changes in demand and cost pressures are location-specific and largely outside of the control of the NHS. No recognition of this basic fact is given in the NHS funding formula (Jones and Kellett, 2018).
Role of temperature
One of the sources of volatility in deaths is the sensitivity of death to temperature. Minimum population deaths occur somewhere around 17–23oC, although this varies slightly between countries (Ekamper et al, 2009; Chen et al, 2018). High temperatures tend to be more deleterious than lower ones. As we all know, day-to-day fluctuation in temperature in the UK is one of those quaint aspects of living in this part of the world (Jones, 2013). Clearly only the most vulnerable die—those already in the last year of life trajectory—with temperature being the ‘last straw’ which triggers the cause of death (Chen et al, 2018).
Deaths from causes such as cardiovascular diseases, pneumonia and influenza, chronic obstructive pulmonary disease (COPD), suicides and motor vehicle accidents are therefore highly seasonal (Trudeau, 1997; Chen et al, 2018). However, this is only a part of the overall and unusually high local volatility in deaths and, hence, end-of-life workload.
Unexpected on/off switching
When monthly or weekly deaths are analysed using a rolling (running or moving) 12-month or 52-week total, hidden patterns emerge which defy current explanations. In a rolling annual total, each point is the sum of the previous 12 months (or 52 weeks); hence, seasonality is effectively removed from the rolling total. A rolling total is especially effective for detecting hidden patterns of on/off switching. This hidden pattern appears to have a switch-on which lasts approximately 12 months, followed by switch-off which lasts until the next switch-on event occurs. Switch-on implies that deaths (and hospital admissions) suddenly jump to a new and higher level (Jones, 2015a).
Switch-on and switch-off therefore create the appearance of sawtooth patterns in a rolling total. Hence, just before switch-on, there are 12 months of deaths at the lower baseline level. At switch-on, there are now 11 months of the previous lower level plus 1 month of the new higher level; move forward 1 month and the total now has 10 months of the lower level plus 2 months of the higher level. After 12 months of the higher level of deaths, the rolling total has reached a peak equal to the value of the initial jump or step-like increase in deaths.
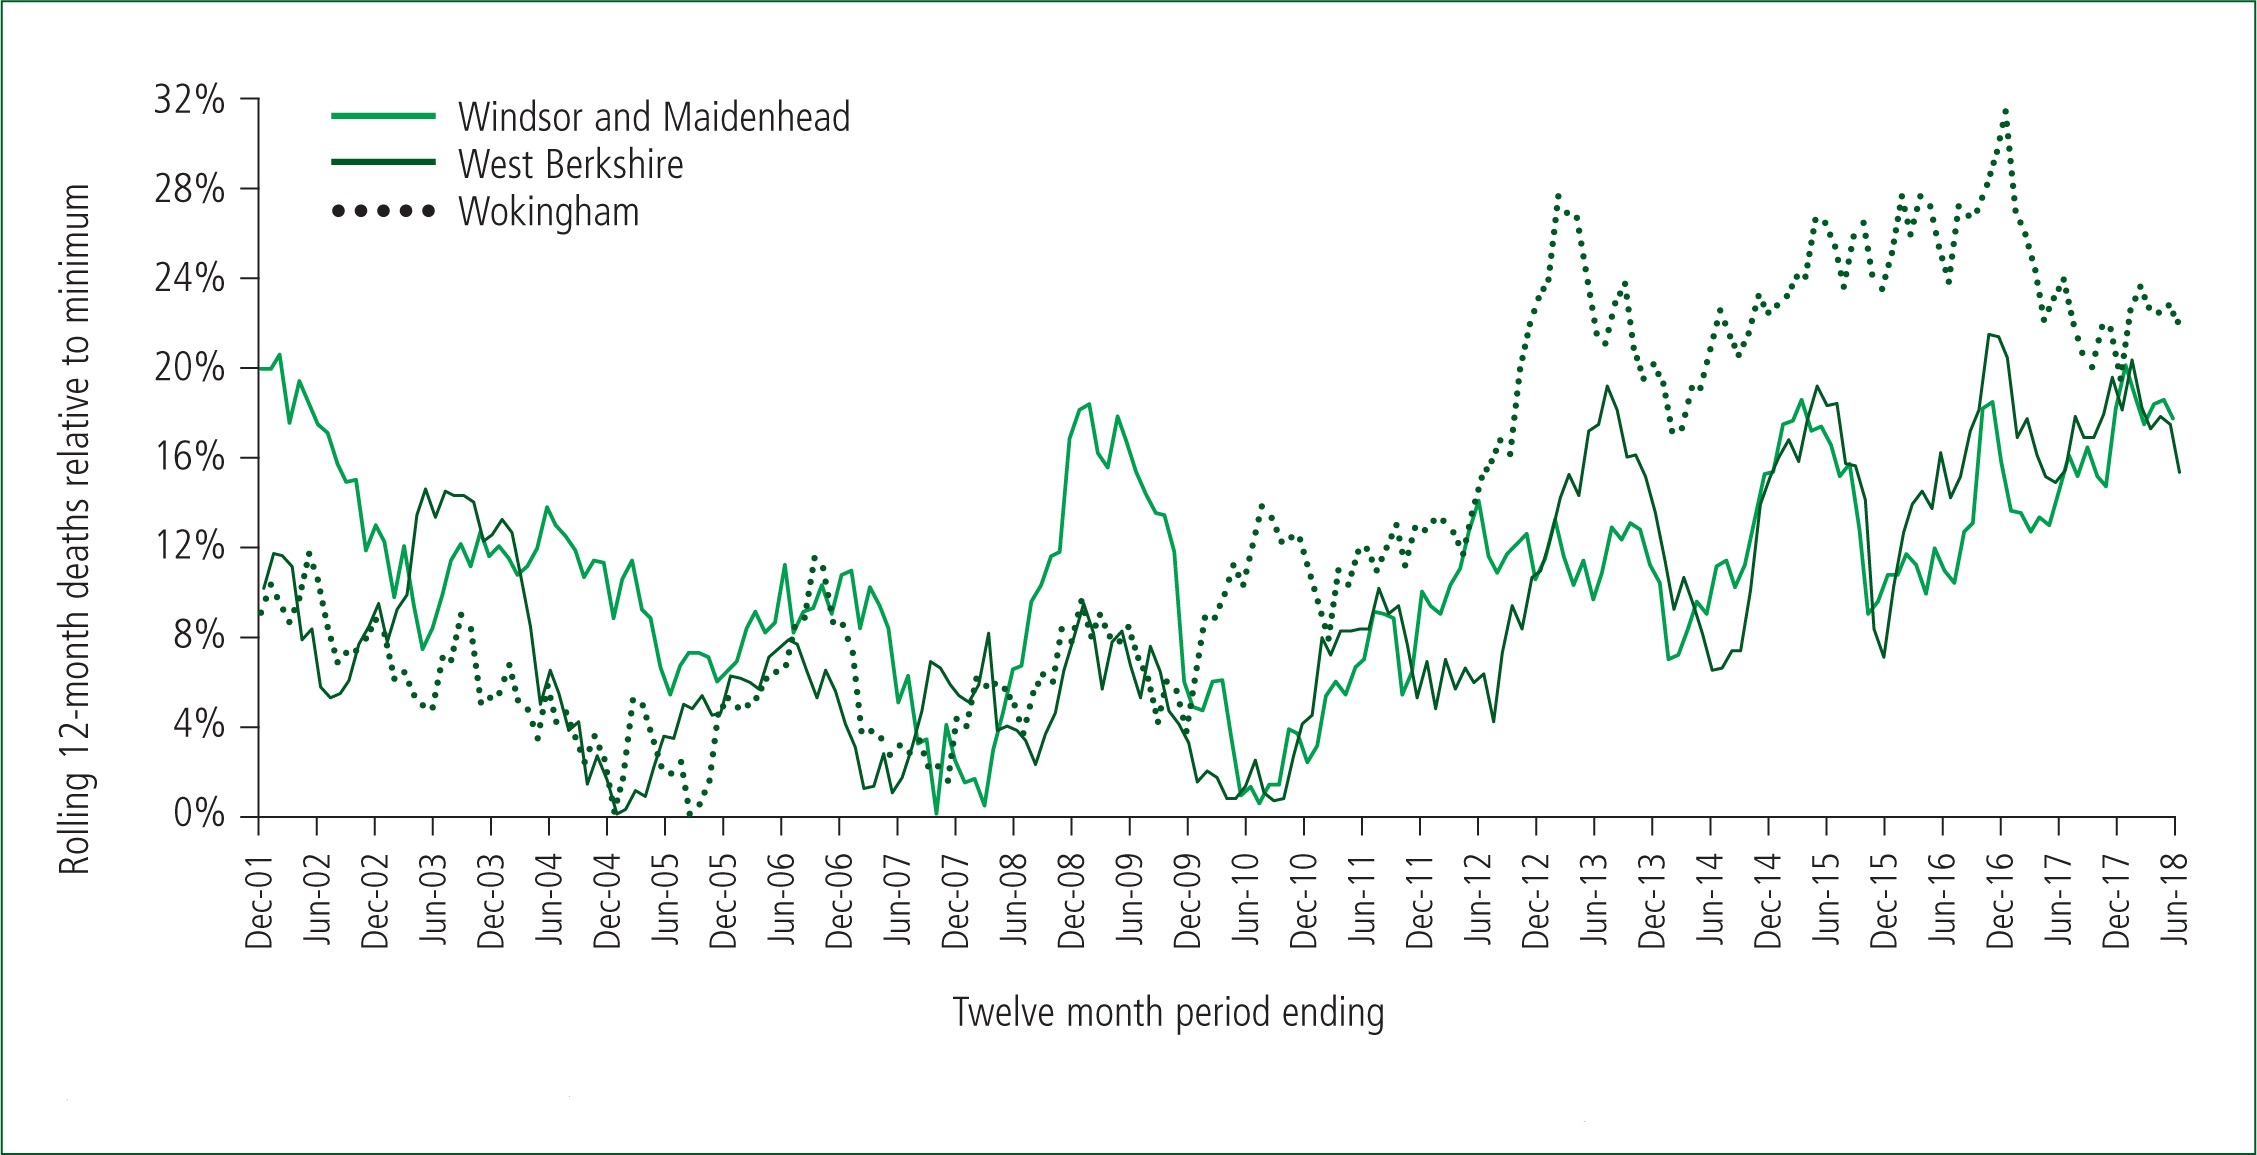
Figure 1 shows a typical example chosen at random from local authority areas in Berkshire in England. The sawtooth behaviour expected from on/off-switching is evident.
My unpublished analysis shows that a rolling 12-month total/average of natural phenomena such as sunspot numbers and temperature do not show sawtooth patterns, i.e. the behaviour seen for deaths is not an artefact of the method.
Simple randomness does not create sawtooth behaviour. Spike events such as an influenza outbreak do not create sawtooth patterns but create table-top features, i.e. the spike enters the rolling total, stays in the total for 12 months and then drops out of the total.
Hence, what is seen in Figure 1 is a mix of on/off-switching plus spike events. For example, there is a table-top feature in Windsor and Maidenhead arising from a spike in deaths in January 2008, which is imposed on top of a switch-on occurring around May 2008. However, the switch-on in Figure 1 for Wokingham and West Berkshire, which commenced around September 2010, gives a neat sawtooth because there are no spike events of any significance. Switch-on events are only very roughly aligned throughout Berkshire indicating moderate synchrony between local authority areas.
These switch-on events have been happening for many years but have simply been ignored because they were not supposed to exist (Jones, 2018). Clearly an external agent is required to initiate switch-on behaviour.
The expected large influenza events in the winter of 2014–2015 and 2017–2018 do not appear to feature strongly in the rolling total. Instead, switch-on is the dominant force upon deaths. Indeed, have we misinterpreted the extent of influenza mortality in the absence of the outbreaks of the other agent? (Jones, 2017).
However, the key point from Figure 1 is that local end-of-life demand can suddenly switch-on by up to 18%, remain at this high level for 12 months, and then suddenly switch-off back to the usual baseline level. Figure 1 also shows how the total number of deaths is changing over time in different locations, as highlighted in the previous article of this short comment series (Jones, 2019b).
Switch-on occurs at neighbourhood level
Just as the trend in deaths for the whole of Berkshire will be a composite picture of its constituent local authority areas, so is the trend in each local authority a composite of local neighbourhood trends. The sharpness of the sawtooth features depends on the synchrony between the neighbourhoods (Jones, 2015b). For example, the 2010 event generally showed low synchrony between neighbourhoods while the 2012 and 2014 events showed higher synchrony.
Conclusion
NHS demand trends are far more complex than currently recognised (Jones, 2016). End-of-life demand shows highly erratic behaviour. Previously ignored on/off-switching dominates this behaviour. NHS demand is profoundly affected by on/off-switching and local areas need to be retrospectively funded for this behaviour, which is entirely outside of their control. Under the current situation, this erratic behaviour will create enormous friction between purchasers and providers, and NHS England appears content to blame the NHS for a source of cost and service pressures over which they have no control. It would be sensible to expect that research into this unusual behaviour becomes somewhat of a priority.