
This winter, the pressure was on (Scobie, 2018). Ambulance crews had a get-together and those from area X were complaining about what a hard winter they were experiencing. Those from Y (just down the road) were sniggering in their cups of tea at those lightweights up the road.
The concept of on/off switching in deaths (and hence end-of-life acute and ambulance demand) was introduced in Part 3 of this series (Jones, 2019). In on/off switching, deaths and associated end-of-life demand suddenly jump to a new and higher level; they remain high for around 12 months and then switch-off and revert back to the usual baseline position. In view of this series on the role of nearness to death in the marginal changes in NHS workload, it may be useful to investigate just how variable winter workload can be in adjacent districts. Hospital admissions peak in the last month of life (Jones et al, 2016; Thorn et al, 2016); hence monthly deaths become a good measure of workload.
Excess winter mortality
To this end, Figure 1 presents a calculation of excess winter mortality (EWM) for England and three local authorities in Berkshire. EWM is defined as the average deaths in the 4 months from December to March versus the 4 months either side (August to November; April to July) (Johnson and Griffiths, 2003). Figure 1 takes the EWM calculation and converts it into a rolling proportion, e.g. start with the standard calculation at March 2002, move forward 1 month and recalculate. This approach is useful because it helps to visualise the shape of the trend. Of special interest is that EWM in the same county does indeed vary significantly even in adjacent areas. There are marked differences in both magnitude and timing, with Bracknell Forest experiencing a surge in deaths for the EWM calculation centred around October 2018. In some years, the trend for England is bi-modal which is the result of timing and magnitude behaviour in local authorities across the whole of England.
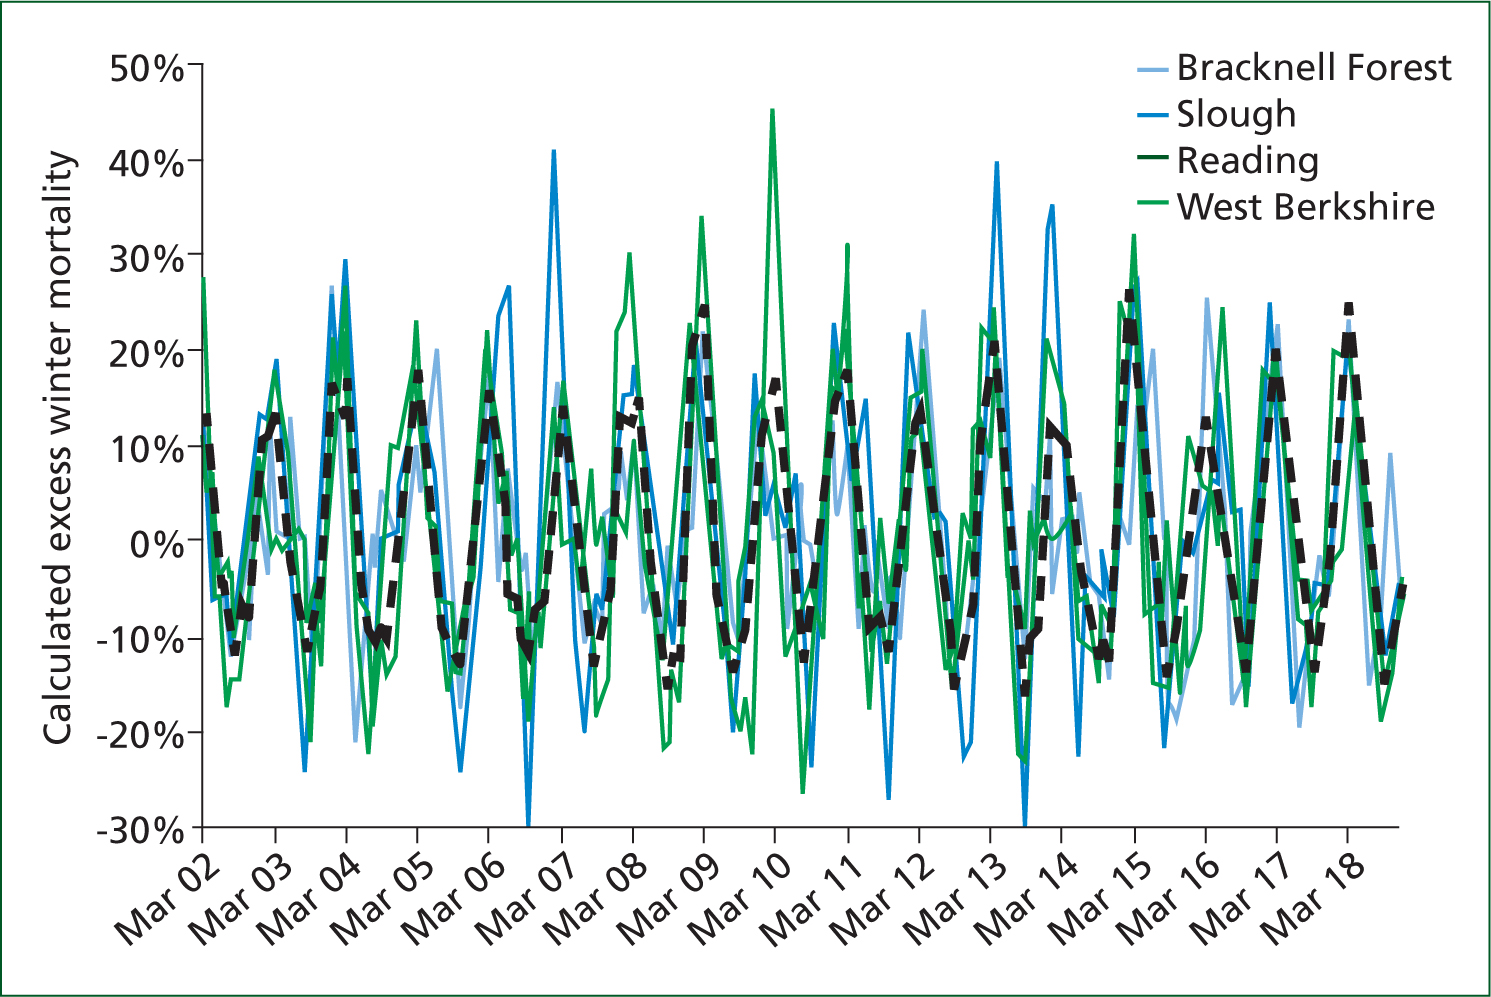
For the whole of England, the winter of 2014/15 had the highest EWM since 1999–2000 (Office for National Statistics (ONS), 2015), although this picture was not shared across Berkshire with only 10% EWM in Bracknell Forest compared with 32% in Reading. However, Bracknell Forest reaches its peak in April rather than March.
While temperature has a profound effect on deaths and cause of death (Chen et al, 2018; Scobie, 2018), the data for a single county (Berkshire) in Figure 1 was specifically chosen to exclude the effects of temperature gradients. Hence the most likely cause for the wildly different EWM between local authorities in Berkshire will be outbreaks of common winter viral infections (coronavirus, cytomegalovirus, influenza(s), norovirus, parainfluenza, respiratory syncytial virus, rhinovirus, etc), which can then trigger more severe pneumonia and other conditions, especially in the young and elderly. With this in mind, Figure 2 shows the range in deaths by month of the year for England from 2001 to 2018.
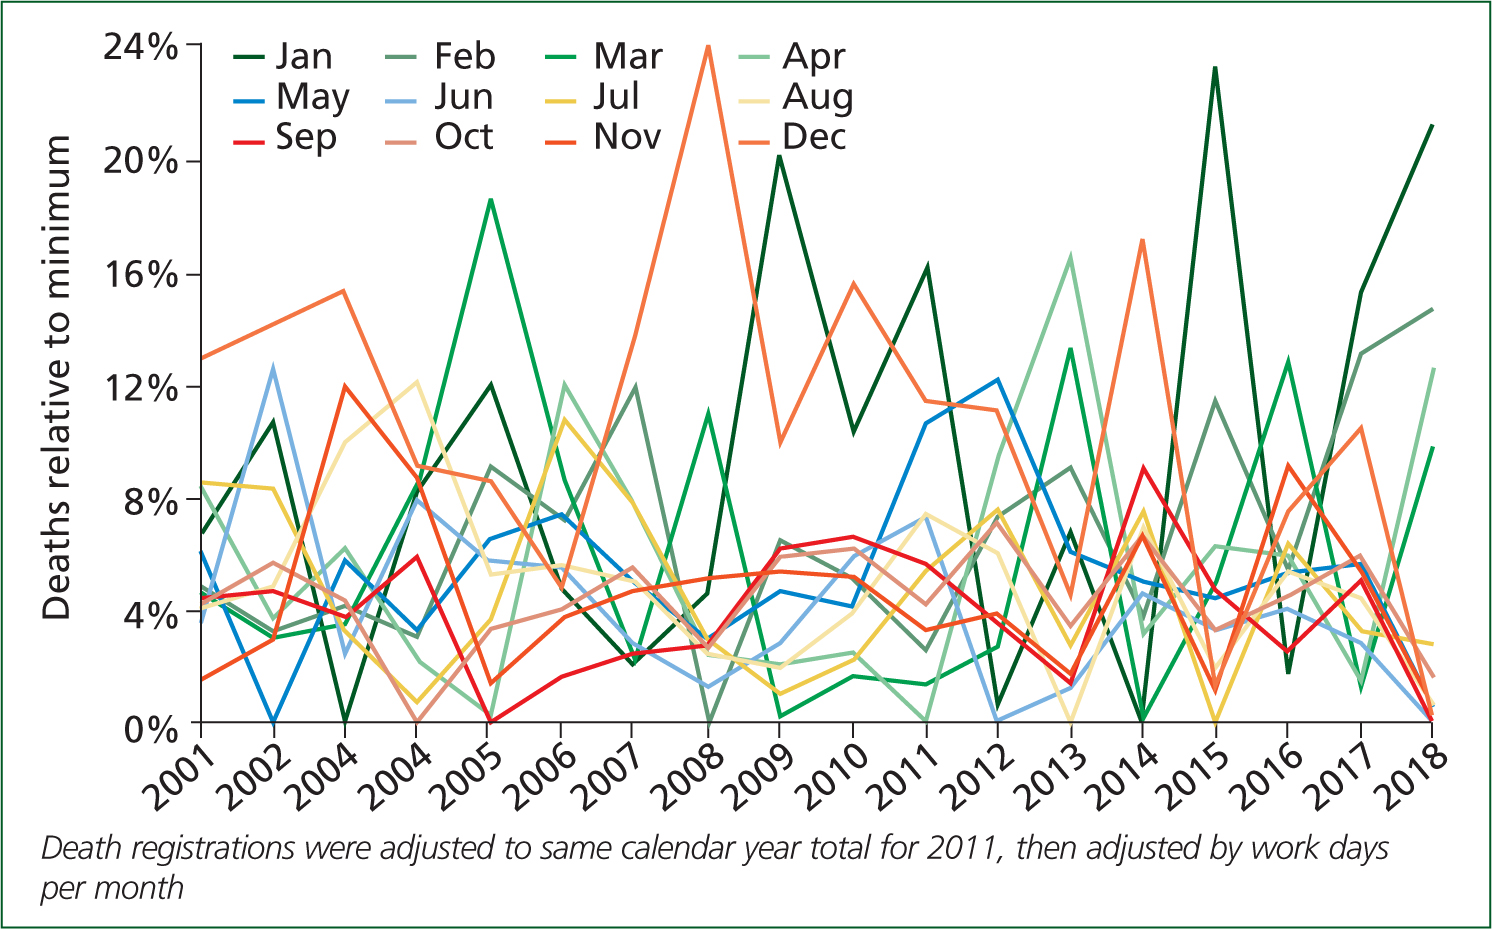
Figure 2 is summarised by the word ‘chaotic’. Deaths for each month can bounce between a minimum and a maximum depending on the year. Temperature variation (away from the usual monthly average) is unable to account for this extreme variation. So how may on/off switching be contributing to this chaos?
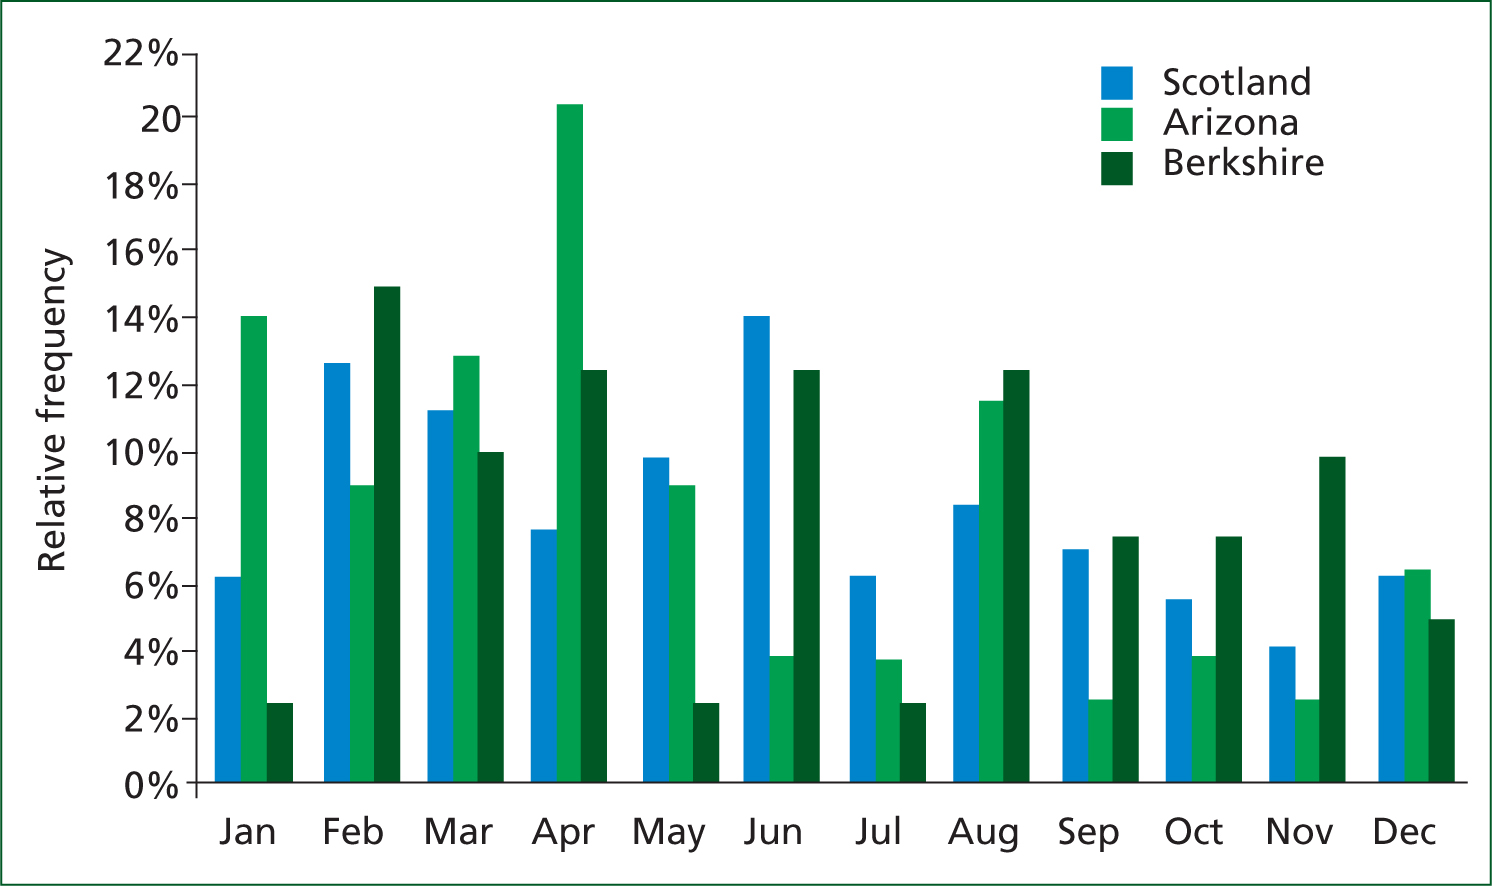
To illustrate, Figure 3 shows the relative frequency of switch-on events for local authorities/counties in Arizona, Berkshire and Scotland during the last two decades. Arizona is included to show that switch on/off is international in scope. As can be seen, switch-on most commonly occurs in late winter/early spring but can have an out-of-season peak in August. At local authority level, switch-on can create a typical 20% increase in deaths, which endures for around 12 months; hence frequency of switch-off follows the same pattern. Events of this magnitude are enough to enhance the chaos seen in Figure 2. Around 33–42% of switch on/off occurs in the winter months (as per EWM) and this will add to the variability in EWM seen in Figure 1.
On/off switching would seem to be the hidden hand enhancing or diminishing winter demand. Fascinating, that something with no official recognition is having such profound effects on NHS demand and costs.