
The UK road traffic volume is estimated to currently produce 5% of air pollution and greenhouse gases (Sustainable Development Unit, 2017), of which 16% has been identified to be linked to the NHS infrastructure and transport (Sustainable Development Unit, 2012). It is not clear what proportion of this comes directly from the UK NHS ambulance fleet.
With health costs resulting from exposure to air pollution totalling more than £20 billion and contributing to approximately 40 000 deaths per year (Royal College of Physicians, 2016), the NHS has developed environmental targets to reduce its carbon emissions by 80% by 2050 (Health Business UK, 2017). The UK Government intends to ban the sale of petrol and diesel engines by 2040 (Lord Carter of Coles, 2018).
The UK government estimates that particulates—a type of pollution—reduce life expectancy in the UK by around 6 months in areas of low air quality, costing around £16 billion a year (Department for Environment, Food and Rural Affairs, 2015). The main pollutants from petrol, diesel and fossil fuel engines are carbon monoxide (CO), oxides of nitrogen (NOx), unburnt hydrocarbons and particulate matter (Vehicle Certification Agency, 2017). Particulate matter (PM) affects those suffering from pre-existing respiratory conditions in particular and has been recognised as a contributing factor to 29 000 deaths per year in the UK (Vehicle Certification Agency, 2017).
Hydrocarbons contribute to ground level ozone formation, which may also pose a risk to people's respiratory systems, with the added potential to be carcinogenic (Vehicle Certification Agency, 2017). In 2011, the European Union claimed that road transport was responsible for 40% of sources of NOx (European Environment Agency, 2013). There is undoubtedly a strategic, financial, environmental and public health case to be made for sustainable development in the provision of greener healthcare services in the UK.
Organisational interventions
With UK NHS ambulance trusts answering more than 10 million 999 calls in 2017, and the average ambulance vehicle travelling 50 000 miles per year (Lord Carter of Coles, 2018), several ambulance services have recognised the need to take action. The Yorkshire Ambulance Service (YAS) NHS Trust vehicles travel approximately 31 000 000 miles per year (Yorkshire Ambulance Service, 2017). YAS is the first in the UK to participate in a Carbon Trust (2017) Carbon Management Programme, putting them at the forefront of kick-starting a carbon movement to establish greener ambulance services nationwide. YAS has trialled an extended-range electric vehicle within its emergency fleet (Health Business UK, 2017), as well as conducting aerodynamic tests of ambulance vehicles (Carbon Trust, 2017).
North West Ambulance Service (NWAS) NHS Trust (2017) has begun trialling electric rapid response vehicles (RRVs) in its fleet, predicting a saving of up to £2.5 million per vehicle over a 4-year period. Similarly, the East Midlands Ambulance Service (EMAS) NHS Trust will attend emergencies in Nottingham City Centre in an electric BMW i3 to determine whether electric vehicles can become a permanent part of its fleet (GreenFleet, 2017).
South Central Ambulance Service (SCAS) NHS Trust is the first ambulance service in England to introduce solar panels onto its RRVs (Health Business UK, 2017). Considering that ambulance engines are currently reported to be left running for 65% of a shift (Williamson, 2011), using 0.9 kg of fuel per hour to maintain radios, GPS units and equipment, the introduction of these vehicles with solar panels by SCAS means that some vehicles will no longer stand at idle to charge these essential systems—potentially saving approximately 7 kg of fuel per 12-hour shift.
Individual-level interventions
Organisational interventions such as those just mentioned are critical to ambulance services becoming greener but there are also a number of ways that individual paramedics and other ambulance staff can reduce the emissions of the ambulance fleet. Promoting greener driving styles, reducing idling time and avoiding unnecessary patient journeys, in line with the NHS Five Year Forward View (NHS England, 2017) are a number of interventions that may help to reduce greenhouse gas (GHG) emissions.
In addition to reducing GHG emissions, there may also be a reduction in the amount of money spent by ambulance services on fossil fuels. Any percentage reduction in GHG will logically have an associated decrease in the current average fuel spend of £6 million per annum by NHS ambulance services (Harmer and Hignett, 2018).
UK NHS ambulance services have developed varied ways to achieve this, such as eco-driving programmes being used by YAS, resulting in a 10% saving on fuel (Green Environmental Ambulance Network (GrEAN), 2011). These initiatives have estimated savings of £1.5 million per annum (GrEAN, 2011) for YAS. If factors such as driving styles are addressed initially, fuel costs and thus emissions, will be reduced with relatively little up-front expenditure compared with fleet replacement.
Emissions are categorised into four groups—Scope 1 to 4—depending on the nature and source of their production (Table 1). A conventional diesel-powered ambulance generates Scope 3 emissions during its manufacture. When left on charge using a shore line, it is using electricity that is purchased from the national grid; the emissions produced generating that power are Scope 2 emissions. Finally, when the ambulance gets sent to a call, the emissions created from the combustion of fossil fuel are classified as Scope 1. When the diesel-powered ambulance is decommissioned and recycled, the emissions created from this process are referred to as Scope 4 emissions.
| Scope 1 | Emissions from direct energy consumption e.g. diesel burned in a vehicle |
| Scope 2 | Emissions from the production of purchased energy e.g. electricity |
| Scope 3 | Emissions from making goods e.g. electric or diesel-powered ambulances |
| Scope 4 | Emissions from the disposal and recycling of products e.g. decommissioning of service vehicles |
The manufacture of new vehicles (whether electric or diesel-powered) would produce scope 3 emissions. Electric vehicles produce significantly more Scope 2 emissions than conventional diesel-powered ambulances but produce zero Scope 1 emissions (Boles, 2017).
A literature review was conducted to establish whether an electric vehicle fleet would reduce costs and Scope 1 emissions for ambulance services.
Methodology
The databases PubMed, ScienceDirect and GreenFILE were searched for English language publications in the last 7 years (Table 2). These databases were searched based on the Patient, Intervention, Comparison and Outcomes (PICO) format that was adapted to suit the research topic (Aslam and Emmanuel, 2010). Boolean operators such as ‘AND’, ‘OR’ and ‘NOT’ were used to combine search terms. Medical Subject Headings (MeSH) were used and inclusion and exclusion criteria were applied (Table 3).
| Term | Database | |||
|---|---|---|---|---|
| PubMed | ScienceDirect | GreenFILE | ||
| 1 | Ambulance | 14200 | 12495 | 62 |
| 2 | Police | 19888 | 129289 | 1311 |
| 3 | Fire and Rescue | 832 | 21901 | 60 |
| 4 | Emergency Service | 136334 | 232037 | 1594 |
| 5 | Rapid Response Vehicle | 700 | 123407 | 805 |
| 6 | Pre Hospital | 3616 | 915315 | 1 |
| 7 | Out of Hospital | 1034846 | 153329 | 68 |
| 8 | Community respond | 108142 | 319409 | 219 |
| 9 | 1 OR 2 OR 3 OR 4 OR 5 OR 6 OR 7 OR 8 | 103882 | 13071 | 3213 |
| 10 | Emission free | 12829 | 580799 | 206 |
| 11 | Global warming | 7889 | 192069 | 13604 |
| 12 | Green | 223014 | 1701601 | 69909 |
| 13 | Carbon footprint | 894 | 30775 | 1498 |
| 14 | Eco friendly | 2667 | 36719 | 1024 |
| 15 | Carbon neutral | 5382 | 86996 | 519 |
| 16 | Eco efficient | 66 | 137948 | 135 |
| 17 | Greenhouse gas | 5237 | 557736 | 6293 |
| 18 | Biofuel | 14412 | 95309 | 6360 |
| 19 | 10 OR 11 OR 12 OR 13 OR 14 OR 15 OR 16 OR 17 OR 18 | 237235 | 16564 | 101298 |
| 20 | 9 AND 19 | 603 | 150 | 307 |
| Inclusion criteria | Exclusion criteria |
|---|---|
| English language only | No structured ambulance service |
| Ambulance service related | Air ambulance and aviation emissions |
| Published in the last 7 years (2010 onwards) |
A secondary data search was completed by hand-searching reference lists of identified articles and carrying out an author search. It was apparent that several of the same authors were publishing the majority of the papers identified, potentially identifying a constraint of expertise in this area of research and also a risk of bias.
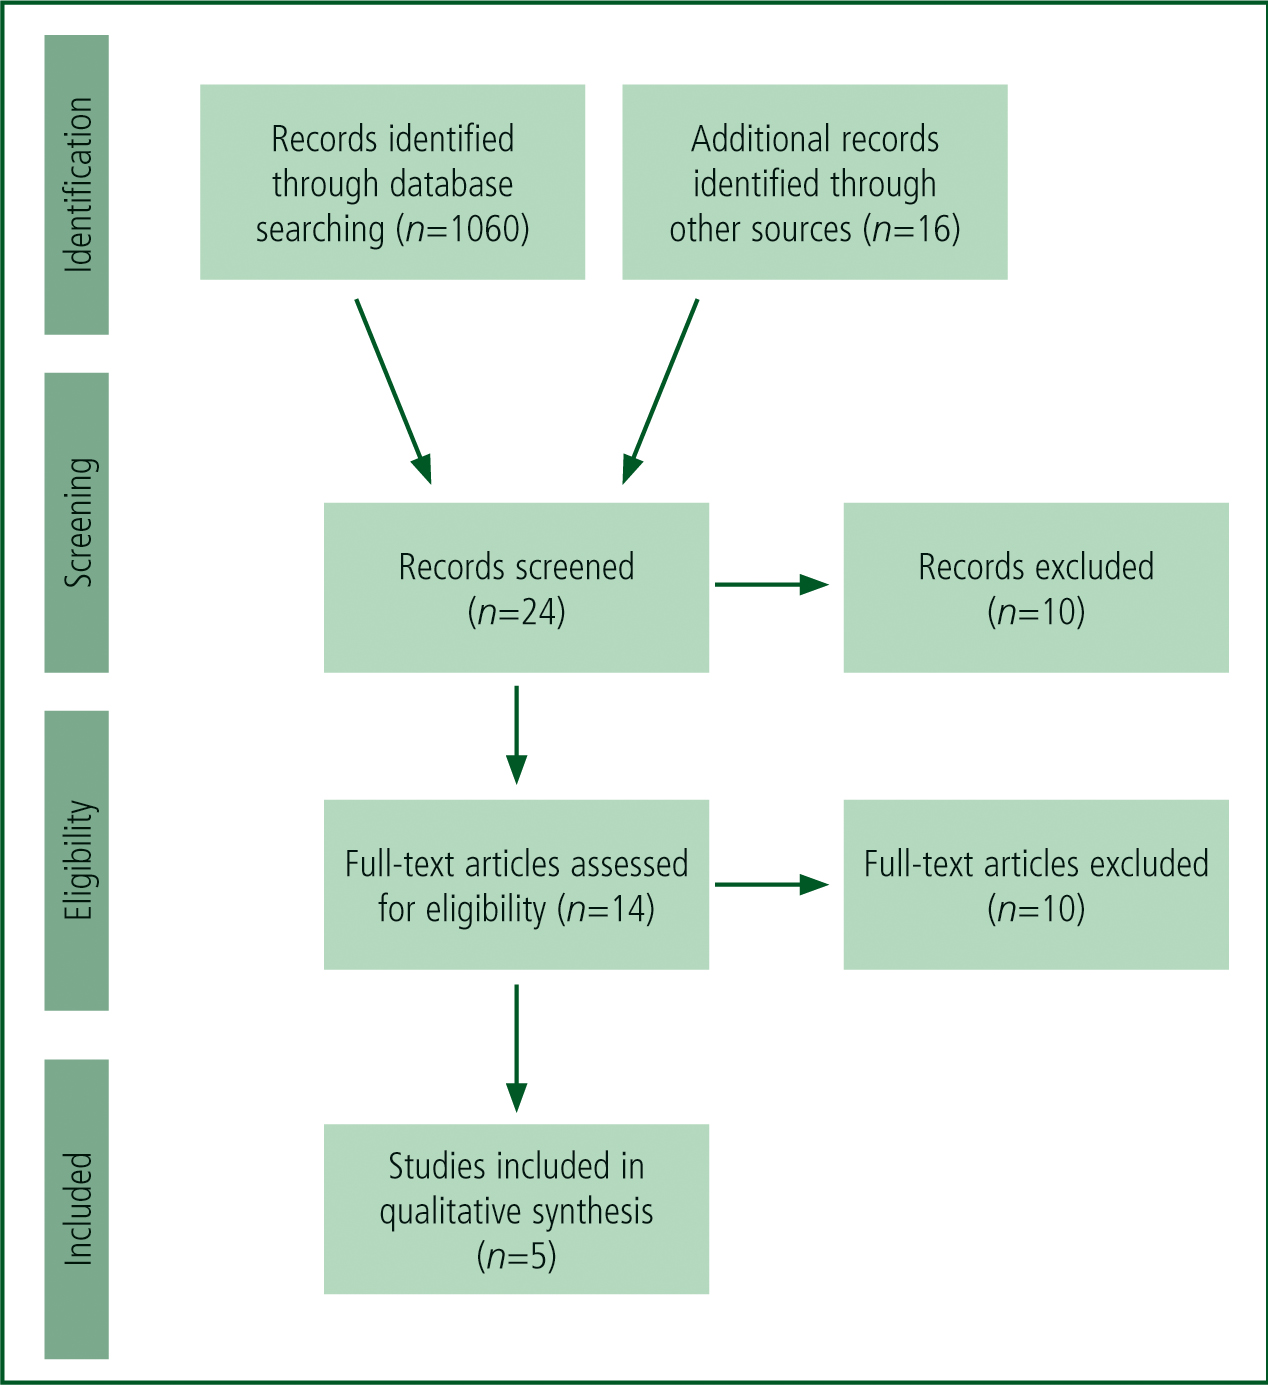
After these additional articles had been identified, a search process was developed using a PRISMA (2009) flow diagram (Figure 1) to outline the inclusion/exclusion process. Of the articles identified (n=1076), five were deemed most relevant to the research question. The articles selected for inclusion were appraised using the recognised Critical Appraisal Skills Programme (CASP) (2006) appraisal tool. This was strengthened through application of the process and principles developed by Wallace and Wray (2016). This ensured a robust critical appraisal for each article included in the review, which is presented in a summary table (Table 4) using a method derived from Aveyard (2014).
| Author/date | Aim of study/paper | Type of study/information | Main findings/conclusions | Strengths and limitations |
|---|---|---|---|---|
| Blanchard and Brown (2012) | To understand the energy consumption associated with health services, and emphasise how important it is that they adapt to a more low-carbon economy. Specifically focusing on emergency medical services | Randomised controlled trial | The energy dependence of emergency medical services, specifically their dependence on fossil-fuel-based liquids, is highlighted. Suggested methods to improve the efficiency of these services such as reducing idling time, use of hybrid vehicles or use of bio-diesel to power vehicles. It also is said that emergency medical services operational efficiency can contribute to a larger sustainability in healthcare | The authors state that there is a degree of uncertainty in the energy consumption and emissions estimates. The figures they used were a large proportion of estimates rather than being explicitly measured, which could result in over- or under-estimation of energy consumption. The authors state that any bias in their calculations would most likely represent an under-representation of figures |
| Buettner et al (2012) | To review the English language literature on the energy burden and environmental impact of health services | Systematic review | Thirty-eight publications were identified, which concluded that reducing health-related energy consumption alone will not resolve the problems that energy scarcity and climate change create; however, it would make a huge contribution | A downfall of this review is that the results have no confidence intervals for the reliability of data. However, the results of the review are made clear and the main outcome of the review is clearly identified |
| Brown et al (2012) | To determine greenhouse gas emissions associated with Australian ambulance operations | Case control study | Emissions for ambulance services total 67 390 metric tons of CO2, averaging 22 kg of CO2 per ambulance response. Vehicle fuels were identified as the primary source for emissions of ground ambulance operations. Emissions for air ambulance transport are substantially higher | Makes references throughout to the ‘Scope’ system of energy. Good to use in the present review as it compares Australian ambulance operations which are similar to that of UK ambulance service operations |
| Judd et al (2012) | To analyse data from an inventory of ambulance service Scope 1 emissions to estimate the life cycle greenhouse gas emissions of Australian ambulance operations | Clinical case study | Approximately 20% of ambulance service operations emissions arise from the consumption of vehicle fuels. Reducing emissions from vehicle fuel consumption is the most obvious strategy that they could employ to reduce their carbon footprint. Reductions in each ambulance response could result in a substantial cumulative reduction in emissions across entire services/countries | The data used have the potential to not accurately reflect the true environmental impact of Australian ambulance operations. This is identified as a common limitation of top-down estimates of carbon footprints. However, the authors identified this as a weakness but suggested how this could be overcome with a use of Scope 1 and 2 energy consumptions as well as an inventory of purchases to make more specific Scope 3 estimates. Another limitation is that this analysis uses the terms ‘Scope 2 emissions’ and ‘electricity-related emissions’ synonymously |
| Zander et al (2010) | It was identified that there had been little research done on the carbon footprint of different healthcare service models, so a review was conducted on the service models for patients with acute ST elevated myocardial infarction (STEMI) | A cohort study | When the new primary percutaneous coronary intervention (PPCI) model was compared to that of the old thrombolysis model, it was discovered that PPCI has more than tripled ambulance journey-related carbon emissions for patient with STEMI. They promote that environmental profiling of service modernisation projects could motivate carbon reduction strategies and design patient care pathways that will reduce patient transport and emissions as a result | The presumption is made that the geography of myocardial infarction events during the study period is predictive of myocardial infarction geography in the future; future changes in the spatial distribution of cases may mean some of the forecast mileage will not be accurate. The study did not consider carbon emissions associated with visitor journeys, patients' return journey or follow-up appointments |
Analysis
Through the analysis of the literature selected for review, two main themes were identified:
Environmental impact of ambulance services
The mass of CO2 produced per ambulance response varies according to different research papers ranging from 22 kg of CO2 per journey (Judd et al, 2012) to 36.6 kg of CO2 per journey (Blanchard and Brown, 2011). Approximating CO2 produced per ambulance journey is challenging as the data come from a range of makes and models of vehicles from a pool of international ambulance data. The figure of 31.3 kg of CO2 per response represents the average of all data available from articles included in this study. It is recognised that this figure is an approximation, although it is still a useful estimate of CO2 produced per ambulance response until further evidence becomes available. It is likely that there will be significant variation from this mid-point average owing to various factors; for example, vehicle type, driving style, weather conditions, traffic conditions and topography.
Buettner et al's (2012) systematic review considered the energy burden and environmental impact of health services with proposals of methods to reduce GHG emissions as a result. Similarly, Blanchard and Brown (2012) conducted a study exploring the energy consumption and emissions associated with health services. With the NHS being responsible for 3% of the UK's GHG emissions (Blanchard and Brown 2012) and a projected increase in its carbon dioxide emissions from 21 million (Sustainable Development Unit, 2008) to 23 million metric tons by 2020, the implementation of significant reduction strategies is vital (Brockway, 2010 cited in Buettner et al, 2012). With Blanchard and Brown (2012) reporting that vehicle fuel represents 80% of the NHS energy burden, they calculated the raw energy consumption per ambulance response at 441.7 mega joules (MJ). This is applicable to the strategy suggested by Judd et al (2012): if reductions were made per ambulance response, a summative reduction could be made nationwide.
Zander et al (2010) specifically investigated the carbon emissions produced in the transport of myocardial infarction (MI) patients under a primary percutaneous coronary intervention (PPCI) pathway. They compared this to the previous thrombolysis pathway for patients who suffered an MI and have seen a significant rise in the GHG emissions as a result. Their study found that although a PPCI model has improved the quality of patient care, it has in turn increased carbon emissions by up to three times (Zander et al, 2010). The effectiveness and improvement in patient care mean that the new PPCI model is in place for the foreseeable future.
One way of reducing MI-related mileage and emissions may be through a reduction in air pollution nationwide as emissions are linked to poor cardiovascular health (British Heart Foundation, 2017). Arguably, a reduction in emissions with a resultant reduction in GHG-related health conditions may lead to fewer cardiovascular consequences occurring on a yearly basis, further reducing mileage and emissions associated with delivery of optimal healthcare.
According to Zander et al (2010), if the number of suspected STEMI events requiring NHS hospital admission was to be halved to 1650 per year, the distance travelled would reduce to 69 600 km/year for the PPCI model reducing the CO2 to approximately 61.4 tonnes/year. This study aims to inform a wider debate about the emissions produced by ambulance services, and to encourage further research to achieve a reduction in GHG-related emissions.
In addition to the emissions cost of individual patient journeys, a specific issue found in the literature relates to engine idling times of ambulance vehicles. With the total engine idling time being reported as 65% of each 12-hour shift (Williamson, 2011), a reduction in idling time can improve both the carbon footprint of UK ambulance services, alongside a significant fossilfuel consumption improvement.
Brown et al (2012) conducted a study on ambulance service operations in Australia in order to establish their GHG emissions and proposed strategies to reduce their environmental impact. Their study is relevant to the UK with Australian ambulance services having approximately 159 ambulance responses per 1000 population, which is comparable to a UK model (London Ambulance Service, 2011 cited in Brown et al, 2012).
Quality improvement strategies
UK ambulance trusts currently collectively spend over £200 million on their fleet every year (the largest area of non-pay expenditure) (Lord Carter of Coles, 2018); this demonstrates that both environmental and financial savings could be made.
To achieve a reduction in GHG emissions per ambulance response, a number of suggestions have emerged from the current review. One example would be to reduce engine idling time. Ambulances are known to be left idling on scene, at station, on standby and at receiving hospitals (Blanchard and Brown, 2012; Judd et al, 2012) to ensure essential systems are fully functional.
Use of vehicle data-monitoring systems, also known as ‘black boxes’, could provide real-time data on efficiency and may reduce fuel costs by up to 14% on ambulances and 22% on RRVs, as well as reduce maintenance costs by up to 20% (Lord Carter of Coles, 2018). Furthermore, these systems may be used to evaluate the effectiveness of eco-driving programmes and flag staff members whose driving is commendable or in need of further development.
Another proposition is the introduction of hybrid/electric vehicles into ambulance services, or the use of bio-diesel as a fuel source (Blanchard and Brown, 2012; Buettner et al, 2012; Judd et al, 2012). This is also supported by Lord Carter of Coles (2018) as a long-term alternative to diesel or petrol-powered engines.
It is also suggested in all of the articles included in this review that the use of plug-in hybrid vehicles could create a more efficient vehicle fleet, but the complication is that they may simply be shifting Scope 1 emissions to Scope 2 emissions depending on the fuel source for electricity generation. Another suggestion derived from the review was the use of hydrogen fuel cell vehicles (FCVs). However, the process of hydrogen production can profoundly increase Scope 2 GHG emissions despite offering improvements to local air quality. It is concluded that battery-powered/electric vehicles would be an ideal proposal for moving forward, as these would produce lower life-cycle GHG emissions than both conventional and hybrid engines.
YAS has set up the Green Environmental Ambulance Network (GrEAN) which is a network of ambulance trusts looking to become more sustainable. They have identified that ambulance services across the UK are very different to the rest of the NHS as they are predominantly fleet-based organisations which present many different challenges when trying to achieve a reduction in nationwide carbon footprint (Transport Business, 2017). The main challenge being faced is the establishment of a consortium which will design and build an operational vehicle with the capacity to respond as an ambulance, provide value for money, minimise emissions and ensure a high-quality service.
The East of England Ambulance Service (EEAS) NHS Trust is at the forefront of designing a more emergency-efficient vehicle with its new bespoke ambulance, which is due to be rolled out into emergency operations later this year. They have invested £6 million into 55 vehicles, which maintain the box-shape but are significantly lighter, making them more CO2 efficient, reducing maintenance costs. There is a projected saving of £3.3 million annually when their entire fleet is replaced (EEAS, 2018).
Discussion
Nationally, the UK ambulance fleet stands at over 5000 vehicles (3200 ambulances and 1500 RRVs) (Lord Carter of Coles, 2018). Ambulance vehicles have an average life expectancy of 6 years before a full replacement is required. Current figures highlight that almost half of these ambulances are operational for over 5 years; 26% are operational for over 7 years; and 6%, over 10 years. EEAST's average age of vehicle disposal is 5 years (Lord Carter of Coles, 2018), far exceeding the predicted life expectancy. As a result of electric cars running off motors and batteries as opposed to internal combustion engines (ICE), they have a similar, if not longer, service life (Vitty, 2014). As electric motors have fewer moving parts, this will reduce maintenance costs. There would still be the cost of battery replacement; however, with rapidly improving battery technology, by the time the ambulance service would be ready to implement electric vehicles into its fleets, it is projected that they should be of sufficient performance and life expectancy to be a viable alternative. This in turn should theoretically mean that an electric vehicle has a lower operating cost when in service than its ICE counterparts (Quora, 2010).
The upfront expenditure of converting an ambulance fleet to electric vehicles could be compared to Transport for London's electric buses. They are significantly more expensive to build. However, maintenance and running costs are significantly lower than the current average of £4200 per vehicle per year (Lord Carter of Coles, 2018), and they can travel up to 180 miles on a single charge resulting in a reduction in London's air pollution (Gizmodo, 2016). With ambulance services experiencing significant upfront expenditure every 6 years to replace their fleet, a cost saving per ambulance response by using electric vehicles could make a significant reduction nationwide in ambulance services' GHG footprint. This would in turn result in further savings, both financially and in terms of improving public health through reduced local emissions of oxides of NOx and particulates.
Conclusion
It can be concluded from this array of academic literature that ambulance services are a major contributor to overall health-sector GHG emissions. Because of the service delivery model requiring the driving of vehicles, it can be said that the ambulance services are a unique part of healthcare provision with the majority of emissions resulting from the use of diesel and petrol. The literature appears to be in consensus that a reduction in GHG emissions requires both organisational and individual changes in order to create a significant impact.
Use of electric or hybrid vehicles has the potential to reduce these GHG emissions resulting from each ambulance response and may also offer a reduction in maintenance and upkeep costs. The potential environmental benefits of an electric or hybrid fleet need to be considered critically. It has been demonstrated that charging on a shoreline can save money spent on fuel from engine idling, but this simply shifts the emissions from one scope to another (Scope 1 to Scope 2). Arguably, this shifts the issue of emissions production from one organisation (an ambulance service) to an electricity generating company. It can also be considered that power stations generate electricity from fossil fuels in a more economical way than burning diesel in an internal combustion engine. Buying electricity produced from fossil fuels in a power station shifts where the emissions and particulate matter is produced. This potentially reduces the health risks associated with breathing in particulate matter, toxic gases and unburnt fuel for people in proximity to where ambulance vehicles are in operation.
An unavoidable limitation of this study is the amount of literature available, specifically relating to UK ambulance services emissions. However, this paper may serve as a starting point for discussion, education, organisational change and fleet commissioning for UK ambulance services. Although it is not clear precisely what mass of GHG and pollutants are produced per UK ambulance response (as data are primarily from international studies where ambulance design and local geography are confounding factors), the preliminary conclusions are that it is significant.
Through organisational and individual change, the resulting detrimental impact upon health and the environment that ambulance services create through emissions can be mitigated.