
Following on from a series of articles in this journal which sought to highlight the role of nearness to death upon the marginal changes in health service demand and costs (Jones 2019a-f), this article will commence with some strategic principles and then move on to the tactical specifics for 2019/2020 winter.
Strategic long-term factors
While the ageing population has been increasing health service demand over many years, we need to understand how the less well recognised role of nearness to death may have been acting to influence the trends. To this end, Figure 1 shows the trend in the number of deaths per 1000 population in England since 1968 and the projected trend to 2041.
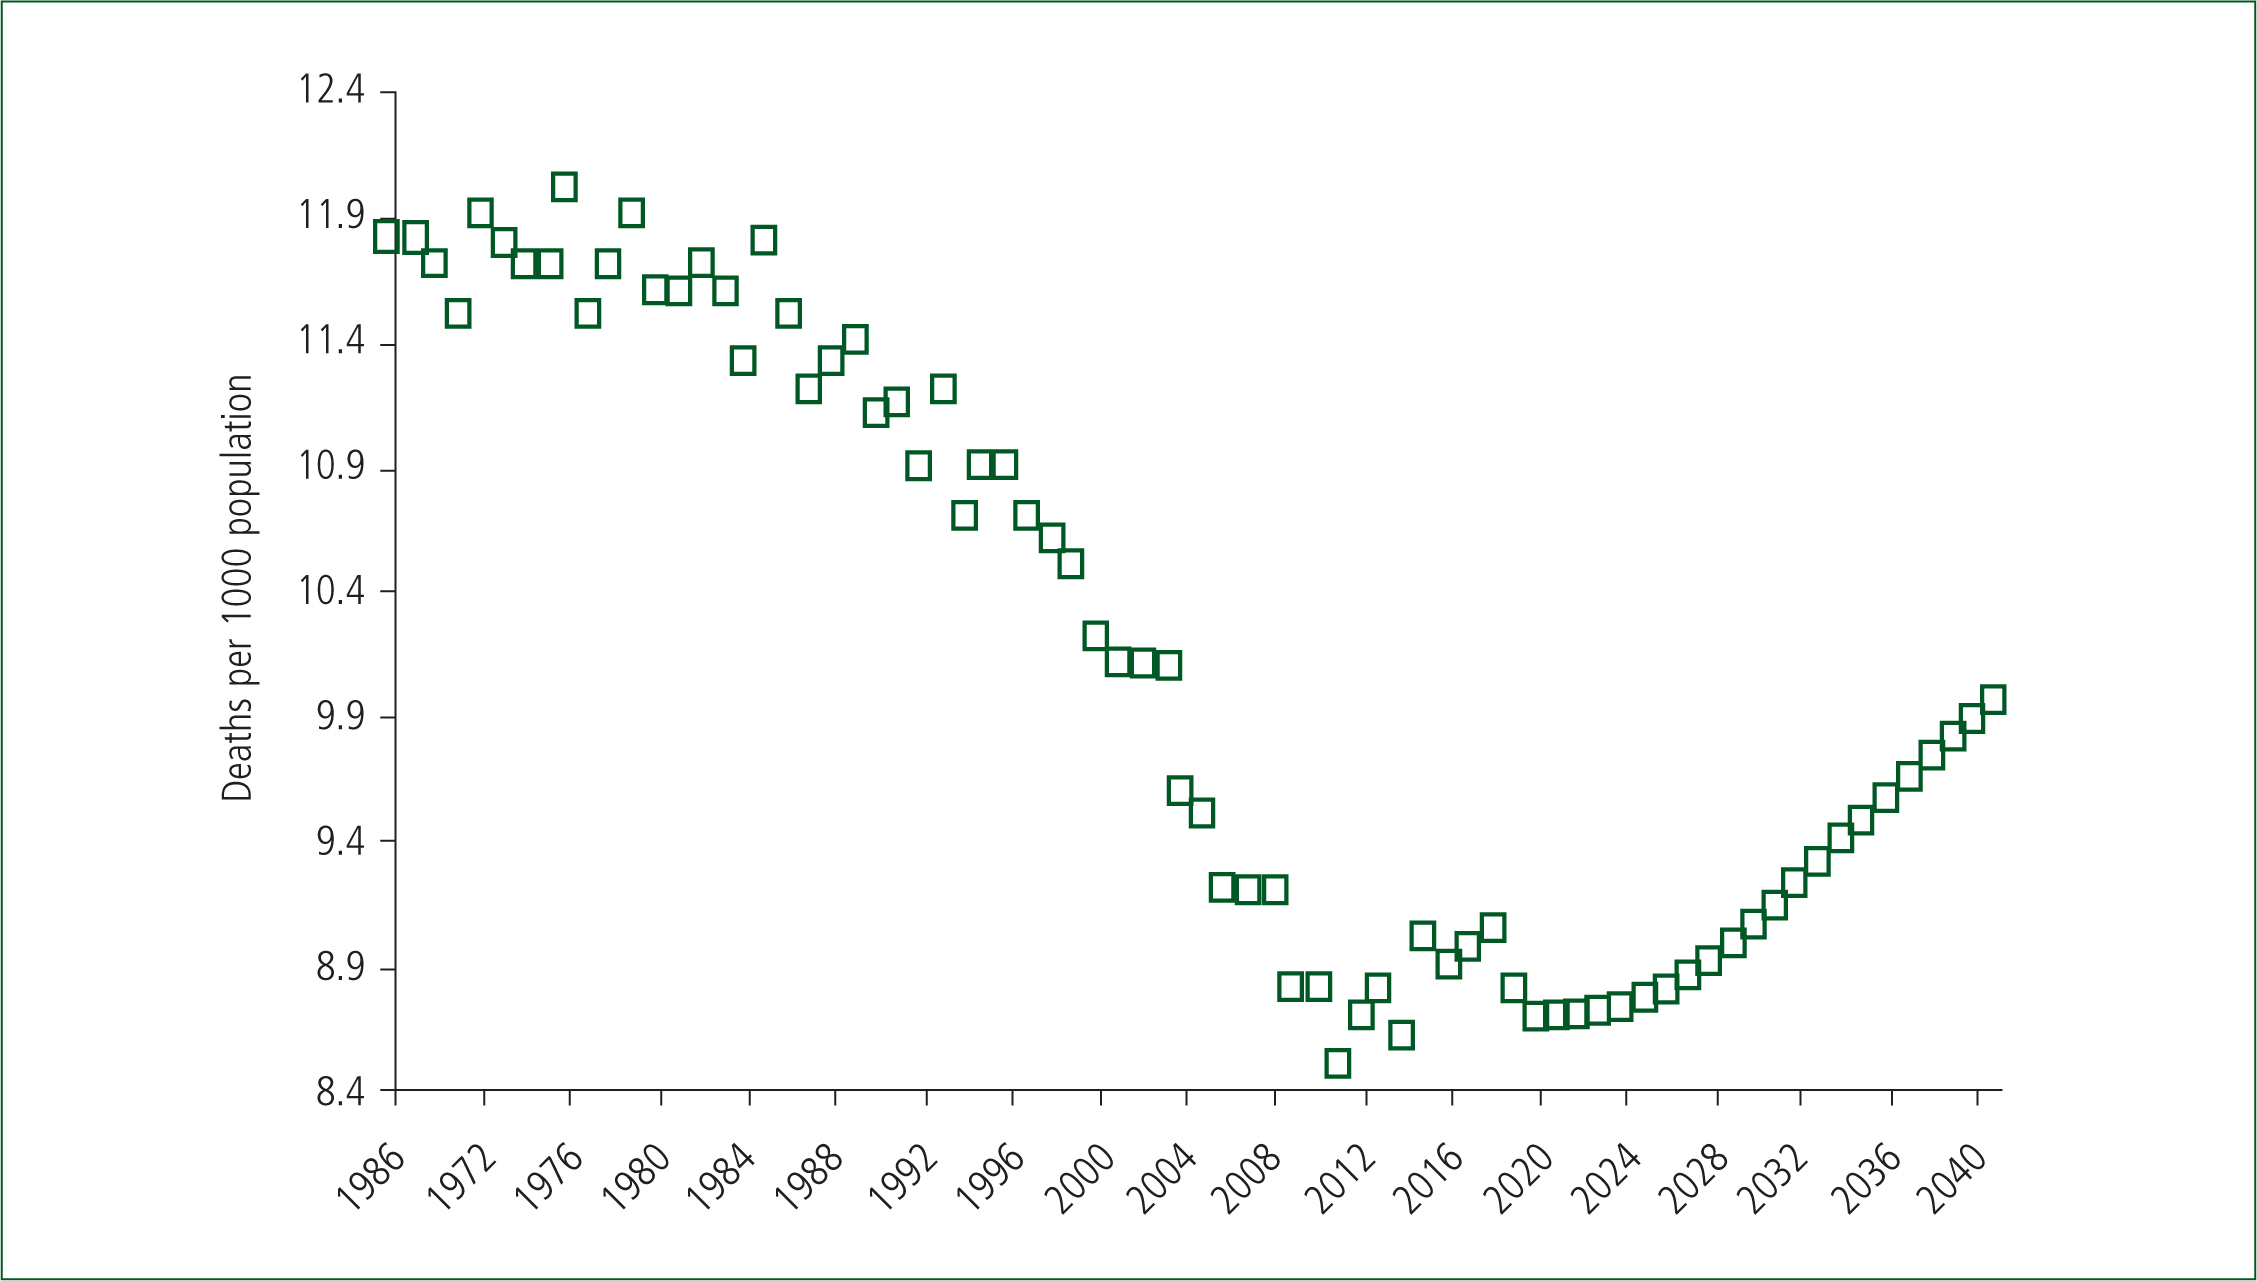
As can be seen, from around 1980 through to 2011, the number of deaths per 1000 population was steadily declining. This is a very important trend because, in those years, the reduction in deaths over time was acting to offset the effect of the ageing population. Both the ageing population and increased end-of-life demand are now acting to augment the trends towards even higher demand. The trend upward after 2011 partly arises from the post-World War II baby boom, in which the leading edge turned 65 in 2011. In the UK, some 83% of deaths occur above age 65 (Office for National Statistics (ONS), 2018), hence the long-term upward trend after 2020 in Figure 1.
The ratio of deaths per 1000 population is a measure of the relative importance of end-of-life care versus non-end-of-life care. In the UK, this ratio ranges from 3.5 in Tower Hamlets (average of 4.5 for Inner London) to 14.7 in Rother (West Sussex), and 15.5 in Tendring (Essex) (ONS, 2019a). Hence places like Rother and Tendring have a five times higher end-of-life care demand compared with Inner London. Integrated care initiatives are most likely to succeed in places with a higher-than-average number of deaths per 1000 people. The former Torbay Integrated Care Organisation with 13.3 deaths per 1000 population (top 3% of local authorities in the entire UK for this ratio), now part of the South Devon Integrated Care Organisation, is an example of this likely success (Thistlethwaite, 2011). Equal success in places like Inner London may be slightly more elusive.
The absolute number of deaths over the next 25 years is projected to show no change in places such as Blackburn with Darwen, Blackpool, Barrow-in-Furness, Burnley, Kingston upon Hull, Boston, Norwich and Crawley. Large cities generally show only modest increases while locations such as Aylesbury Vale, East Northamptonshire, Milton Keynes and Uttlesford have over a 50% increase. However, the ratio of deaths per 1000 population shows a 4–7% decline in places such as Coventry, Havering, Birmingham, Bristol and Bexley to a greater-than-40% increase in places such as Milton Keynes, Rutland, Hart and East Northamptonshire (ONS, 2019b). Hence, the balance between end-of-life and non-end-of-life care is set to change at local level during the next 25 years, leading to changes in the optimum number and location of ambulances and hospital beds. Ambulances can be moved—hospitals, less so.
Tactical implications for the 2019/20 winter
How do the long-term strategic observations and the those detailed in earlier articles apply to the winter of 2019/2020?
As shown in the previous article, a large and sudden shift down in deaths commenced in mid-2018, setting the scene for a potential shift up to initiate from mid-2019 or beyond (Jones, 2019f). While analysis of the behaviour of deaths over the past 19 years in each local authority can indicate a likely maximum value for any shift up, the actual shifts in both deaths and medical admissions can be highly variable and localised to very small areas, or to certain social groups. By implication, the ability to shift resources to match the hot spots is a prerequisite.
Clearly, an influenza outbreak only makes things worse. Interaction with a shift up and an influenza outbreak seems to occur (Jones, 2017). At present, far too little is known about what agent(s) lead to the shifts in deaths and, therefore, about the exact nature of possible interactions.
Early indications from the mid-2019 winter in Australia are that clinical severity of influenza was low, as was the impact on hospital bed occupancy (Australian Government Department of Health 2019). However, mutation of the virus or an altered virus mix could mean a different outcome in the UK. Of note from Australia was that influenza in 2019 came earlier than usual, and occurred in two waves. There was considerable variation between the States of Australia.
However, based on the shift up in deaths, which occurred in early 2014 plus a spike in deaths in January 2015, partly due to influenza, we have a potential scenario for the winter of 2019/2020. The 2014/2015 scenario is shown in Figure 2, where the magnitude of the earlier shift (plus a smaller contribution from influenza in early 2015) is plotted against the increase in excess winter mortality (EWM) in the winter of 2015/2016. Data are restricted to counties and regions with more than 5000 deaths per annum. Smaller areas with less than a 6% shift in deaths have been averaged to give the equivalent to over 5000 deaths.
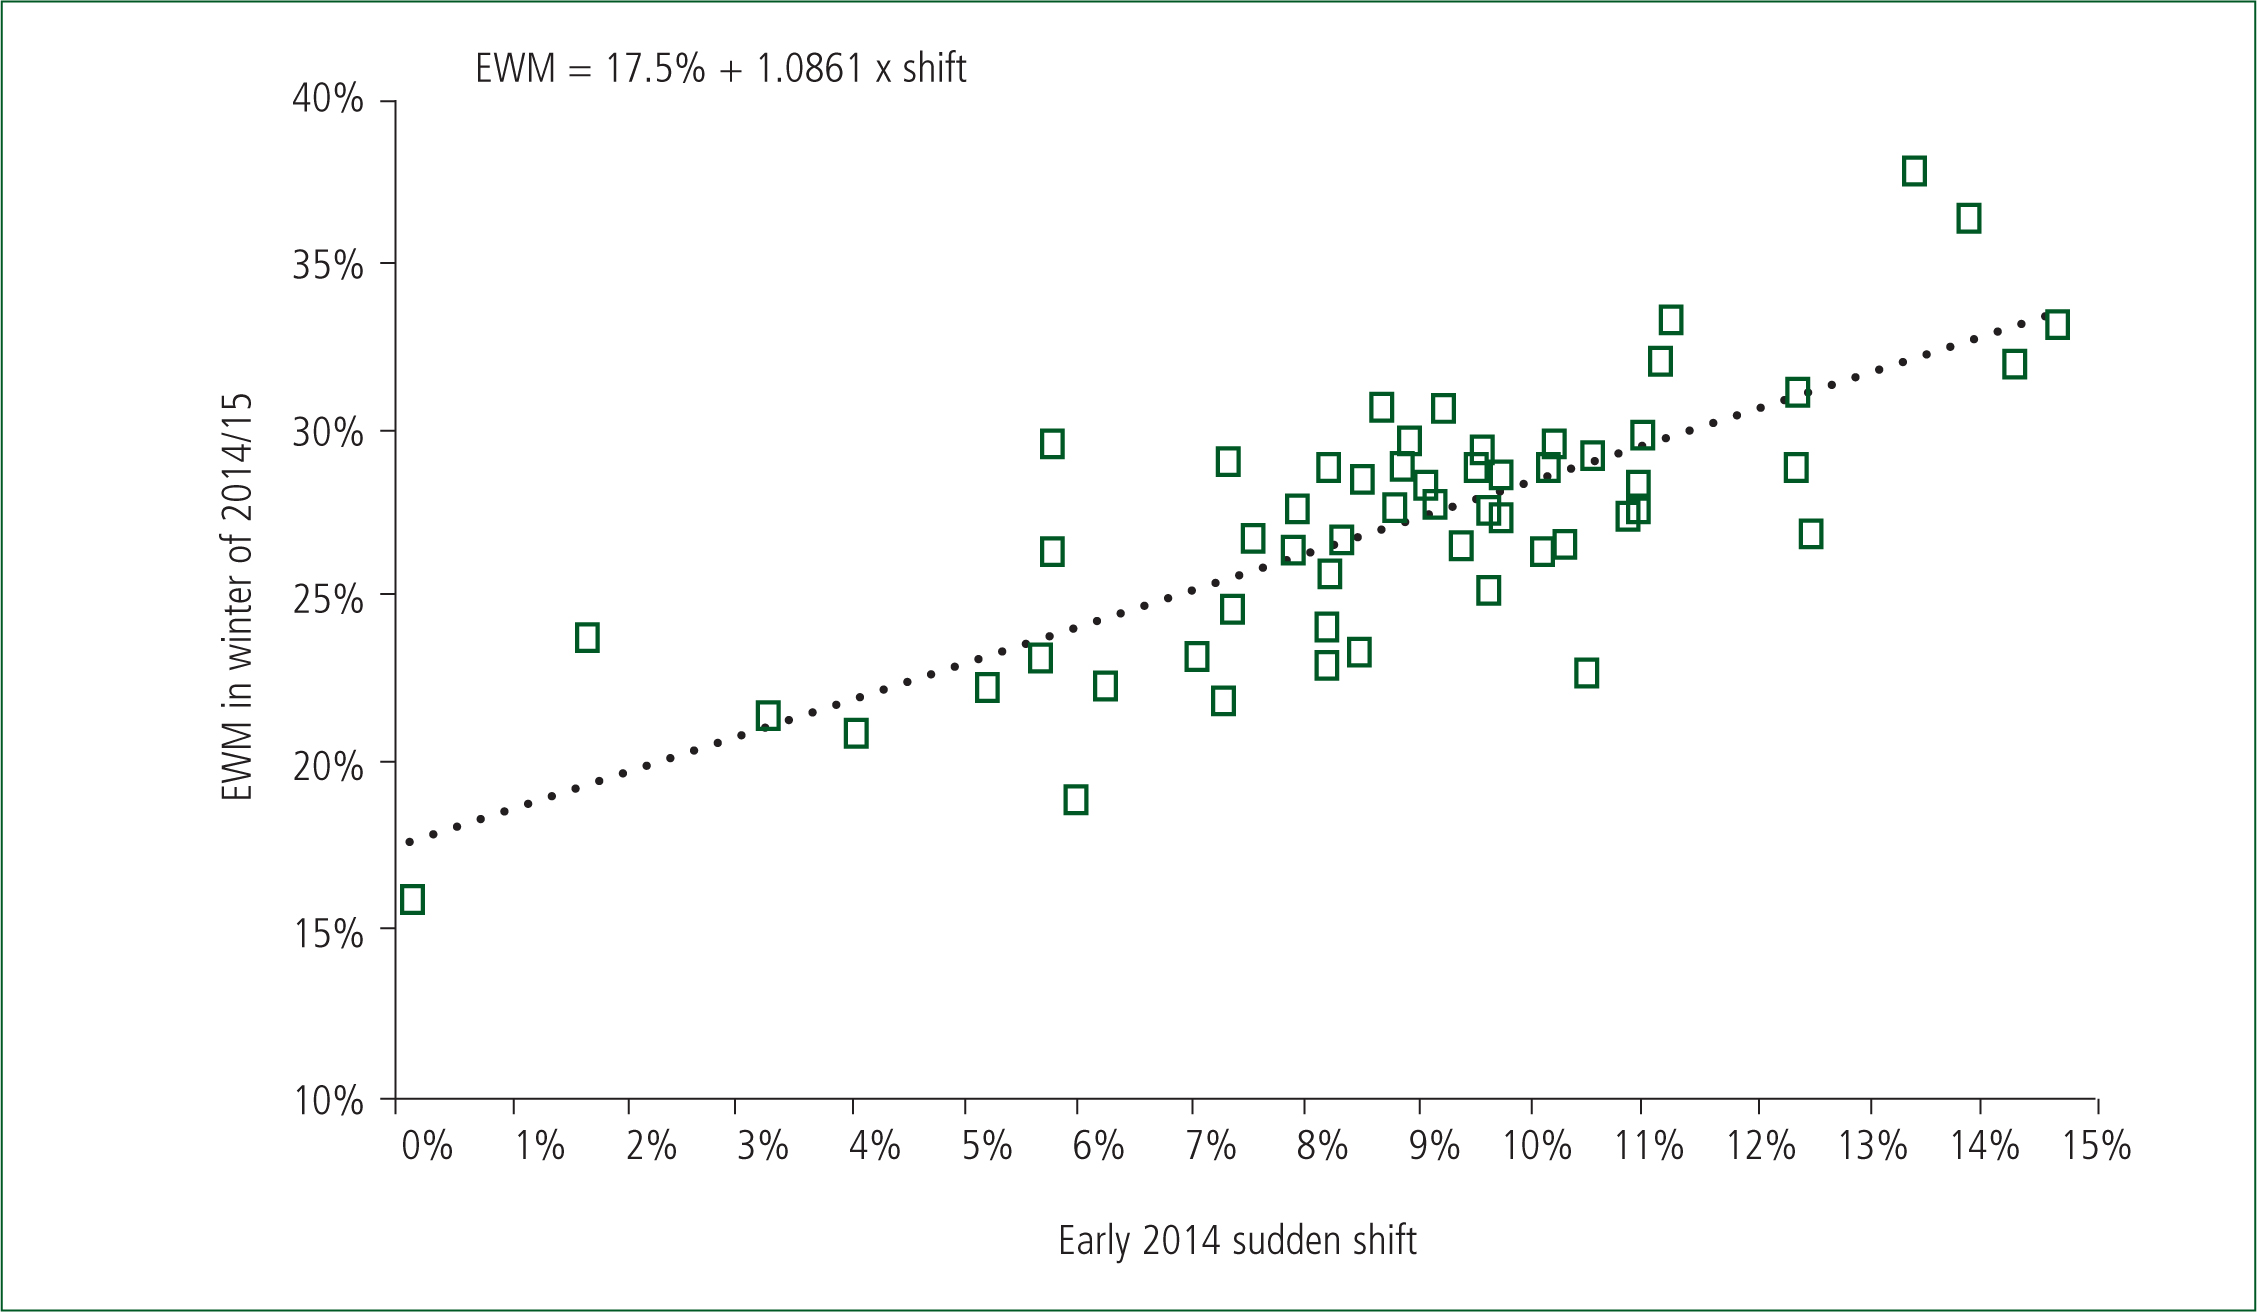
As can be seen in Figure 2, the magnitude of the influenza-augmented shift was highly variable, but there is a direct relationship between the magnitude of the shift and winter workload as measured by EWM. The intercept of 17.5% EWM is the minimum EWM over the past 19 years, i.e. shift up/down and associated interaction with influenza dominates EWM. This confirms the observation by the ONS (2013) that EWM does not correlate well with average winter temperature. Interestingly, world countries that did not show a shift in early 2014 did not experience any increase in deaths due to influenza in the winter of 2014/2015 (Jones, 2019g). Some of the controversies regarding influenza mortality (Cannel et al, 2008) may have an unexpected basis.
The variability in influenza in 2019 between Australian States is also observed between UK local authorities. The author's own analysis shows that evidence for increased deaths due to an influenza epidemic can be clear in one local authority but seemingly absent in another, which is a known characteristic of influenza epidemics (Skog et al, 2014). This is reflected in high variation in the EWM between local authorities shown in the previous article (Jones, 2019f), and in Figure 2.
Most recent weekly data to the start of November shows that large parts of Scotland and the North West of England have moved into shift up. Monthly data for Scotland at the end of October show that only 15% of councils remained in shift down. Trends in other parts of the UK remain mixed. For example, in London, Wandsworth moved into shift up in March while Islington remained in shift down up to September. We must await the arrival of winter to know if influenza will further compound these shifts up in deaths and hence end-of-life related workload. However, very high small-area variation can be guaranteed.
Conclusion
High variation in timing and magnitude of the shifts in deaths, plus the local impact of seasonal influenza, especially upon the elderly, imply that—in theory—both ambulance, and acute capacity need to be flexed to match the resulting hot spots. While ambulance capacity can be flexed (within constraints), acute capacity is far less flexible—hence, ambulance queues outside accident and emergency (A&E) departments. In the years to come, higher levels of integrated care may divert end-of-life care to community-based (palliative) solutions (with attached workload). However, considerable hard work and investment are needed to achieve that goal—although within the context that the ageing and dying population are now working in the same direction to further augment rising demand.
The central problem remains that all capacity planning, including the funding formula, relies on the assumption of smooth trajectories (as in the right hand side of Figure 1), while the real world is dominated by high volatility (as in the left hand side of Figure 1, and also in Figure 2).
The ability to flex resources, including money, is far too constrained by the current system of thinking—and it is this that the science of systems thinking is all about (World Health Organization (WHO), 2009).